General Index 

General House Hunting Articles

Things about Housing Everyone Should Know

Good Towns for Buyers, Good Towns for Sellers

Home Buying, Step by Step

Common Housing Problems and What to Do

Financing

Common Expenses when Buying or Selling Homes

After You Move In

Remodeling Slideshows for Kitchens, Baths, and others!

Newsletters

July 22, 2019

Shrewsbury, MA Home Sales and Real Estate Market Report (2019)

Shrewsbury, MA Home Sales and Real Estate Market Report (2019)

March

The Shrewsbury Homes For Sale Market Report

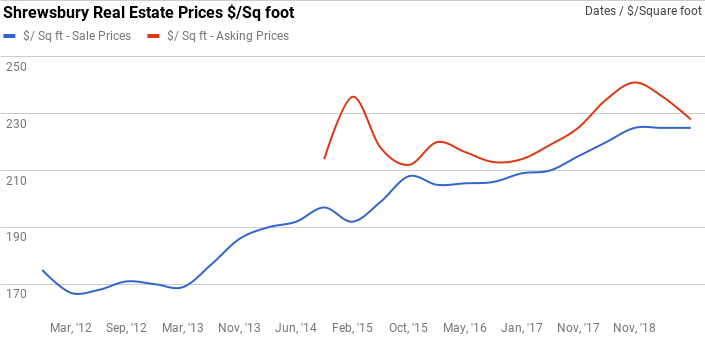
This chart - which shows buyers are no longer pushing prices up in Shrewsbury - doesn't surprise me.  It has felt all spring like the seller's command of the market was slipping.  And the proof is here.  No longer willing to bid up prices, prices have stayed flat - and it's the sellers who have had to come meet the market. 
Can’t see the chart? You can find it Here.

A bit of a surprise here- the transactions had quite the dip.  They are off the highs, but well off that quick dip, where things had trouble moving. The HSI is headed to 100, showing that things have really cooled off.  Panic time for sellers?  Hardly, but early warning rumbles are right here. 

What should potential home buyers do in Shrewsbury?

Home buyers should be aware there are choices and some sellers will be out there too long.  Best advice here is to find home sellers who "messed up" on the price and now have to cut to find a buyer.  Buyers in Shrewsbury have gotten in the (bad) habit of ignoring properties that don't sell in the first weekend.  That's a mistake!  Now some of those will be your best values - if you know how to get it.

Find Your Next Home or Check out the Competition!

What should future home sellers do in Shrewsbury?

Home sellers should recognize that they will have competition, no matter how wonderful their property.  Buyers are no longer bidding things up, so a different strategy will need to take hold.  Be aware things are different, and the getting a quick sale will be harder than it has been previously.

Shrewsbury Homes For Sale and Sold Market Statistics - MLS Data

  • The Shrewsbury “Home Seller Index” (HSI): 124 Last Report: 214
  • There are 102 homes currently listed as For Sale by Home Sellers.
  • In Shrewsbury there have been 219 houses sold in the last 6 months, and 52 homes sold in the last 3 months.
  • The Average number of Days on Market (DOM) was 59 days for the last 6 months of SOLD homes In Shrewsbury.
  • Homes for sale have been looking for buyers for an average of 72 days (the homes currently for sale).
  • The amount that was paid by Home buyers in Dollars per Sq. Ft. averaged $225 (vs. $225 also in the last report)
  • Current home sellers are looking for $228/sq foot
  • There was an Average Sold Price of $486,289.
  • Shrewsbury, MA, has 2 properties advertised as lender owned or foreclosure (typically foreclosure) .
  • There are 2 properties advertised as a short-sale is going to be needed by the lender.

All raw data are for Single Family Houses and based on data in MLS. Matt’s HSI is proprietary*, and is designed to offer town-by-town information, instead of large scale trends. *That means you won’t find it anywhere else. Take that, Case-Schilling!.

An Educated Home Buyer is a Happy Home Owner. Read On!

About Matt Heisler

Matt Heisler is a real-estate professional and owner of this website. He has been selling homes in MA for buyers and sellers for over 20 years. He is an expert in foreclosure purchases, short-sale purchases, short-sale sales, buy and hold investing, fix and flip investing, and of course traditional residential home sales. He is happy to take questions as they pertain to real estate on Title V, Radon, Termites, Sump Pumps, Roofs, Foundations, Wells, Septic Systems, Cash-Flow, Staging, and a host of other housing issues. As a Vanderbilt University alumnus, he is proud to serve his local community.

*All information is posted in good faith and is assumed to be reliable, but may rely on third party information sources.

Posted in Shrewsbury MA
July 21, 2019

Sutton, MA Home Sales and Real Estate Market Report (2019)

Sutton, MA Home Sales and Real Estate Market Report (2019)

July

The Sutton Homes For Sale Market Report

We've seen a number of towns where inventory has ticked upward, in some cases, noticeably.  Sutton is not that town!  Inventory remains tight.  Not surprisingly, with such limited choices, prices in Sutton have moved significantly higher.  The worcester suburbs are going to keep moving until the cycle ends, just as they did last time, and continue to catchup with the towns to their east. 

Can’t see the chart? You can find it Here .

Note the HSI continues to hang around the highs since we've been tracking, although transaction volume has fallen slightly.

What should potential home buyers do in Sutton?

Home buyers should be vigilant and move quickly. The best properties are moving quick and often going competitive.  Even homes that need a lot of work are moving, that's why prices are still moving up.

Find Your Next Home or Check out the Competition!

What should future home sellers do in Sutton?

With prices at or near all time highs, it's a good time to sell in Sutton!  Buyers are working with anyone who has something priced right.  If you want to get a bid war going, make sure your property is ready to go and staged to show off its best features. 

Sutton Homes For Sale and Sold Market Statistics - MLS Data

  • The Sutton “Home Seller Index” (HSI): 158 Last Report: 137
  • There are 22 homes currently listed as For Sale by Home Sellers.
  • In Sutton there have been 66 houses sold in the last 6 months, and 54 homes sold in the last 3 months.
  • The Average number of Days on Market (DOM) was 91 days for the last 6 months of SOLD homes In Sutton.
  • Homes for sale have been looking for buyers for an average of 65 days (the homes currently for sale).
  • The amount that was paid by Home buyers in Dollars per Sq. Ft. averaged $189 (vs. $191 in the last report)
  • Current home sellers are looking for $206/sq. foot
  • There was an Average Sold Price of $404,752.
  • Sutton, MA has 0 properties advertised as lender owned or foreclosure (typically foreclosure) .
  • There are 0 properties advertised as a short-sale is going to be needed by the lender.

All raw data are for Single Family Houses and based on data in MLS. Matt’s HSI is proprietary*, and is designed to offer town-by-town information, instead of large scale trends. *That means you won’t find it anywhere else. Take that, Case-Schilling!.

An Educated Home Buyer is a Happy Home Owner. Read On!

About Matt Heisler

Matt Heisler is a real-estate professional and owner of this website. He has been selling homes in MA for buyers and sellers for over 20 years. He is an expert in foreclosure purchases, short-sale purchases, short-sale sales, buy and hold investing, fix and flip investing, and of course traditional residential home sales. He is happy to take questions as they pertain to real estate on Title V, Radon, Termites, Sump Pumps, Roofs, Foundations, Wells, Septic Systems, Cash-Flow, Staging, and a host of other housing issues. As a Vanderbilt University alumnus, he is proud to serve his local community.

*All information is posted in good faith and is assumed to be reliable, but may rely on third party information sources.

Posted in Sutton, MA
July 19, 2019

Sudbury, MA Home Sales and Real Estate Market Report (2019)

Sudbury, MA Home Sales and Real Estate Market Report (2019)

July

The Sudbury Homes For Sale Market Report

What interesting about this chart is that asking prices haven't really moved since late 2014.  Prices have moved up, slowly, and buyers and sellers are close to agreeing on value.  Clearly, sellers are getting less optimistic about future price appreciation.

Can’t see the chart? You can find it Here .

Here is another town where we suddenly see a spike in inventory. Transactions have moderated a bit, and inventory is up a bit.  This is hardly a buyer's market!  But we are heading to neutral very quickly.  The HSI is only  125, and that is far from the the 200 and 300 that we saw when prices where shooting up.  They may grind higher - but they may stay right where they are. 


What should potential home buyers do in Sudbury?

Home buyers should be optimistic that only the most under priced homes - or those in the busier (lower) prices ranges in Sudbury, will be attracting outsized attention.  I think most homes will be sold without intense bid wars, and many with no wars at all.  

Find Your Next Home or Check out the Competition!

What should future home sellers do in Sudbury?

Home sellers should - and many have already - temper their expectations in the marketplace.  The big push may not be over, but it is most definitely taking a breather.  A check in the fall to see if we go through an inventory build, or an inventory tightening, will tell the tale of 2020. 

Sudbury Homes For Sale and Sold Market Statistics - MLS Data

  • The Sudbury “Home Seller Index” (HSI): 125 Last Report: 192
  • There are 86 homes currently listed as For Sale by Home Sellers.
  • In Sudbury there have been 158 houses sold in the last 6 months, and 129 homes sold in the last 3 months.
  • The Average number of Days on Market (DOM) was 78 days for the last 6 months of SOLD homes In Sudbury.
  • Homes for sale have been looking for buyers for an average of 97 days (the homes currently for sale).
  • The amount that was paid by Home buyers in Dollars per Sq. Ft. averaged $263 (vs. $258 in the last report)
  • Current home sellers are looking for $272/sq. foot
  • There was an Average Sold Price of $828,473.
  • Sudbury, MA, has 0 properties advertised as lender owned or foreclosure (typically foreclosure) .
  • There are 0 properties advertised as a short-sale is going to be needed by the lender.

All raw data are for Single Family Houses and based on data in MLS. Matt’s HSI is proprietary*, and is designed to offer town-by-town information, instead of large scale trends. *That means you won’t find it anywhere else. Take that, Case-Schilling!.

An Educated Home Buyer is a Happy Home Owner. Read On!

About Matt Heisler

Matt Heisler is a real-estate professional and owner of this website. He has been selling homes in MA for buyers and sellers for over 20 years. He is an expert in foreclosure purchases, short-sale purchases, short-sale sales, buy and hold investing, fix and flip investing, and of course traditional residential home sales. He is happy to take questions as they pertain to real estate on Title V, Radon, Termites, Sump Pumps, Roofs, Foundations, Wells, Septic Systems, Cash-Flow, Staging, and a host of other housing issues. As a Vanderbilt University alumnus, he is proud to serve his local community.

*All information is posted in good faith and is assumed to be reliable, but may rely on third party information sources.

Posted in Sudbury, MA
July 18, 2019

Northbridge, MA Home Sales and Real Estate Market Report (2019)

July

The Northbridge Homes For Sale Market Report

Interesting.  We have curve inversion in Northbridge.  Curve inversion is when sellers are currently priced lower than the recent average sale price.  Why does that happen?  Well, the best properties, in the best condition, tend to sell first, but when demand softens, the remaining properties have to cut prices to entice buyers.  That can often lead to a market condition where there are too many properties that need work and not enough buyers, so the average asking price (of properties that need work) drops below the sold (properties that needed less work). That is probably what we have here.

Can’t see the chart? You can find it Here .

What we're seeing also, is a drop in transaction from the last couple of years. We aren't seeing a big spike in inventory, but if transactions continue to fall, we will see that. 

What should potential home buyers do in Northbridge?

Just as in Northborough, Northbridge buyers no longer need to chase property.  The best properties are moving quickly, but many will be passed over initially.  This is a good time to find a fixer-upper where you can build some elbow equity. 

Find Your Next Home or Check out the Competition!

What should future home sellers do in Northbridge?

Home sellers should recognize that the market is headed towards neutral, and while still good, isn't going to be as easy as it was last year or the year before.  With an average of 72 days on market, many homes are taking time to find the right buyer. 

Northbridge Homes For Sale and Sold Market Statistics - MLS Data

  • The Northbridge “Home Seller Index” (HSI): 179 Last Report: 194
  • There are 28 homes currently listed as For Sale by Home Sellers.
  • In Northbridge there have been 99 houses sold in the last 6 months, and 68 homes sold in the last 3 months.
  • The Average number of Days on Market (DOM) was 60 days for the last 6 months of SOLD homes In Northbridge.
  • Homes for sale have been looking for buyers for an average of 72 days (the homes currently for sale).
  • The amount that was paid by Home buyers in Dollars per Sq. Ft. averaged $189 (vs. $189 also in the last report)
  • Current home sellers are looking for $178/sq foot
  • There was an Average Sold Price of $350,363.
  • Northbridge, MA, has 1 properties advertised as lender owned or foreclosure (typically foreclosure) .
  • There are 2 properties advertised as a short-sale is going to be needed by the lender.

All raw data are for Single Family Houses and based on data in MLS. Matt’s HSI is proprietary*, and is designed to offer town-by-town information, instead of large scale trends. *That means you won’t find it anywhere else. Take that, Case-Schilling!.

An Educated Home Buyer is a Happy Home Owner. Read On!

About Matt Heisler

Matt Heisler is a real-estate professional and owner of this website. He has been selling homes in MA for buyers and sellers for over 20 years. He is an expert in foreclosure purchases, short-sale purchases, short-sale sales, buy and hold investing, fix and flip investing, and of course traditional residential home sales. He is happy to take questions as they pertain to real estate on Title V, Radon, Termites, Sump Pumps, Roofs, Foundations, Wells, Septic Systems, Cash-Flow, Staging, and a host of other housing issues. As a Vanderbilt University alumnus, he is proud to serve his local community.

*All information is posted in good faith and is assumed to be reliable, but may rely on third party information sources.

Posted in Northbridge MA
July 17, 2019

Northborough, MA Home Sales and Real Estate Market Report (2019)


July

The Northborough Homes For Sale Market Report

Northborough prices have softened a bit from their peak, and seller expectations have come down even more.  Could a rise in inventory be driving the change? 

Can’t see the chart? You can find it Here .

Yes, here it is.  A rise in inventory (a sharp rise!), has changed the behavior of the market.  Very quickly, it seems, buyers are no longer bidding properties up.  Even though sales are basically flat year over year, just a little bit of inventory has dropped the HSI from 240 top 140.  

What should potential home buyers do in Northborough?

Home buyers should understand that "softer" doesn't equal soft.  There is still plenty of demand, and the best properties, if well priced, will sell quick.  But there is no need to chase prices here.  Homes that need work will need to be marked down to reflect the current prices. 

Find Your Next Home or Check out the Competition!

What should future home sellers do in Northborough?

Home sellers need to make sure their home is priced well and should be in its best condition from Day #1.  Be prepared, once the big wave of buyers goes through, you could be sitting around waiting.  You never get a second chance to make a first impression, and that is very true in today's home seller market in Northborough.

Northborough Homes For Sale and Sold Market Statistics - MLS Data

      • The Northborough “Home Seller Index” (HSI): 137 Last Report: 238
      • There are 48 homes currently listed as For Sale by Home Sellers.
      • In Northborough there have been 113 houses sold in the last 6 months, and 75 homes sold in the last 3 months.
      • The Average number of Days on Market (DOM) was 78 days for the last 6 months of SOLD homes In Northborough.
      • Homes for sale have been looking for buyers for an average of 68 days (the homes currently for sale).
      • The amount that was paid by Home buyers in Dollars per Sq. Ft. averaged $225 (vs. $228 in the last report)
      • Current home sellers are looking for $238/sq. foot
      • There was an Average Sold Price of $493,216.
      • Northborough, MA, has 2 properties advertised as lender owned or foreclosure (typically foreclosure) .
      • There are 0 properties advertised as a short-sale is going to be needed by the lender.

All raw data are for Single Family Houses and based on data in MLS. Matt’s HSI is proprietary*, and is designed to offer town-by-town information, instead of large scale trends. *That means you won’t find it anywhere else. Take that, Case-Schilling!.

An Educated Home Buyer is a Happy Home Owner. Read On!

About Matt Heisler

Matt Heisler is a real-estate professional and owner of this website. He has been selling homes in MA for buyers and sellers for over 20 years. He is an expert in foreclosure purchases, short-sale purchases, short-sale sales, buy and hold investing, fix and flip investing, and of course traditional residential home sales. He is happy to take questions as they pertain to real estate on Title V, Radon, Termites, Sump Pumps, Roofs, Foundations, Wells, Septic Systems, Cash-Flow, Staging, and a host of other housing issues. As a Vanderbilt University alumnus, he is proud to serve his local community.

*All information is posted in good faith and is assumed to be reliable, but may rely on third party information sources.

Posted in Northborough, MA
June 13, 2019

Natick, MA Home Sales and Real Estate Market Report (2019)


March

The Natick Homes For Sale Market Report

Well when we look at the price chart, we do see a bit of a dip there.  Seller's tried to push prices in the spring, but now are cutting prices to get down to where the buyers are.  It's been a really good run, and we've had dips before, but it's worth wondering if this is different.   Let's look at the data.

Can’t see the chart? You can find it Here .


Ok, if we look at the data here, a few things jump out.  A big rise in inventories, and the HSI is at it's lowest point in about 6 years.  The market is still quite good, of course, but nothing here suggests that prices are going sharply higher.  This look pretty significant to me.  


What should potential home buyers do in Natick?

Indeed!  That is the big question.  Certain prices ranges (sub 600K) will still be moving briskly.  But I think we're going to start to see price compression.  Certainly, buyers should be aware that properties that need work should be more carefully considered, as price appreciation may stall here. 

Find Your Next Home or Check out the Competition!

What should future home sellers do in Natick ?

You can still sell, of course,  and prices are still good.  But it may not be as easy as last year, and you might not sell right away, and if you're priced wrong, you'll sit around for sure. 

Natick Homes For Sale and Sold Market Statistics - MLS Data

  • The Natick “Home Seller Index” (HSI): 176 Last Report:240
  • There are 71 homes currently listed as For Sale by Home Sellers.
  • In Natick there have been 214 houses sold in the last 6 months, and 158 homes sold in the last 3 months.
  • The Average number of Days on Market (DOM) was 53 days for the last 6 months of SOLD homes In Natick.
  • Homes for sale have been looking for buyers for an average of 44 days (the homes currently for sale).
  • The amount that was paid by Home buyers in Dollars per Sq. Ft. averaged $321 (vs.$323 in the last report)
  • Current home sellers are looking for $ 333 /sq. foot
  • There was an Average Sold Price of $662,270.
  • Natick , MA, has 0 properties advertised as lender owned or foreclosure (typically foreclosure) .
  • There are 0 properties advertised as a short-sale is going to be needed by the lender.

All raw data are for Single Family Houses and based on data in MLS. Matt’s HSI is proprietary*, and is designed to offer town-by-town information, instead of large scale trends. *That means you won’t find it anywhere else. Take that, Case-Schilling!.

An Educated Home Buyer is a Happy Home Owner. Read On!

About Matt Heisler

Matt Heisler is a real-estate professional and owner of this website. He has been selling homes in MA for buyers and sellers for over 20 years. He is an expert in foreclosure purchases, short-sale purchases, short-sale sales, buy and hold investing, fix and flip investing, and of course traditional residential home sales. He is happy to take questions as they pertain to real estate on Title V, Radon, Termites, Sump Pumps, Roofs, Foundations, Wells, Septic Systems, Cash-Flow, Staging, and a host of other housing issues. As a Vanderbilt University alumnus, he is proud to serve his local community.

*All information is posted in good faith and is assumed to be reliable, but may rely on third party information sources.

Posted in Natick, MA
May 30, 2019

Easy Smooth Closing Tip #1 - Thursday


SMOOTH CLOSING TIP #1

What's in a day?  In real estate, people have preferences as to what day things close.  But there are good days and bad days for closing.  Here are a few factors you should consider when writing - or accepting - an offer for your clients.  Discuss these issues with them.  


  1. Wherever possible, don't close on Friday or Saturday or Sunday.  Thursdays are a much better choice.  Here's why.
    • Everyone wants to close Friday.  It is the biggest close day of the week - and it's much worse at the end of the month.  How can you get attorneys and banks attention if they have 4 closings?  You can't - so avoid the crowd.
    • Banks process closings by close date - not by when they started the application.  Yep!  It sounds stupid, and it is, but most banks work hardest on those closing soonest.  If you're closing Thursday, your file is on top of all the Friday closings every day. 
    • Small delays are common.  Stuff happens.  If it happens on Thursday, you can go to record on Friday, and buyer and seller have the weekend as they wanted.  If things go south on Friday, everyone needs to wait till Monday (or Tuesday for a long weekend!).  This can have MAJOR IMPACTS.  If your seller needs the funds to buy their next house, than two closings will be impacted.  Movers charge extra to re-schedule last minute.  And oftentimes, buyers and sellers have taken time off to move - and now are stuck.  Don't assume that your buyer will get keys if its not on record - they often won't.  And your seller needs to think hard about giving over keys.  If it's not recorded, they have little financial recourse if things happen over the weekend. 
  2. Don't sweat the end of the month.  Most buyers feel that they should close near the end of the month.  They are told they will have lower closing costs - and they will - but what they "save" is a 30 day illusion.  If you close on May 31st, your first mortgage payment will be on July 1st - just 31 days.  If you close on June 5th, your closing costs are higher (the bank takes a payment in advance from June 5th to June 30th), but you won't have a mortgage payment until August 1st, which is 56 days away!   Bottom line, it all comes out in the wash - but as before, if you close in the middle of the month (on a Thursday, right?) then you'll get a lot of attention from Banks and attorneys - much more than you will at the end of the month.  

If all that sounds like a lot to remember, keep it simple and close as many contracts on Thursday as you can!  You won't believe how many headaches it saves you!!  

An Educated Home Buyer is a Happy Home Owner. Read On!

About Matt Heisler

Matt Heisler is a real-estate professional and owner of this website. He has been selling homes in MA for buyers and sellers for over 20 years. He is an expert in foreclosure purchases, short-sale purchases, short-sale sales, buy and hold investing, fix and flip investing, and of course traditional residential home sales. He is happy to take questions as they pertain to real estate on Title V, Radon, Termites, Sump Pumps, Roofs, Foundations, Wells, Septic Systems, Cash-Flow, Staging, and a host of other housing issues. As a Vanderbilt University alumnus, he is proud to serve his local community.

*All information is posted in good faith and is assumed to be reliable, but may rely on third party information sources.
Posted in For Realtors
April 1, 2019

Millis, MA Home Sales and Real Estate Market Report (2019)

March

The Millis Homes For Sale Market Report

Mills has been a steady performer.  Millis is up about 38% from the lows, and it's rise has been steady.  Which makes sense!  Its small and hard to get to, but makes sense for lots of folks.  There's just enough that doesn't work to keep things from getting crazy - but plenty of things that do work to keep prices moving.  

Can’t see the chart? You can find it Here .

Ultimately, the HSI has come down from the peak, but things are still good for sellers - just not crazy good. 

What should potential home buyers do in Millis ?

If Millis works for you, the market isn't overheated.  There just aren't lots of options.  

Find Your Next Home or Check out the Competition!

What should future home sellers do in Millis ?

Traffic is light, but buyers are moving quickly for the right property.  Even homes that don't sell right away find buyers quickly.  Getting your home presentable and priced right will improve your experience.  Going to high is likely to deter buyers. 

Millis Homes For Sale and Sold Market Statistics - MLS Data

  • The Millis “Home Seller Index” (HSI): 206 Last Report:337
  • There are 19 homes currently listed as For Sale by Home Sellers.
  • In Millis there have been 58 houses sold in the last 6 months, and 27 homes sold in the last 3 months.
  • The Average number of Days on Market (DOM) was 28 days for the last 6 months of SOLD homes In Millis .
  • Homes for sale have been looking for buyers for an average of 76 days (the homes currently for sale).
  • The amount that was paid by Home buyers in Dollars per Sq. Ft. averaged 233 (vs. 220 in the last report)
  • Current home sellers are looking for $ 228 /sq. foot
  • There was an Average Sold Price of $474,102 .
  • Millis , MA, has 0 properties advertised as lender owned or foreclosure (typically foreclosure) .
  • There are 0 properties advertised as a short-sale is going to be needed by the lender.

All raw data are for Single Family Houses and based on data in MLS. Matt’s HSI is proprietary*, and is designed to offer town-by-town information, instead of large scale trends. *That means you won’t find it anywhere else. Take that, Case-Schilling!.

An Educated Home Buyer is a Happy Home Owner. Read On!

About Matt Heisler

Matt Heisler is a real-estate professional and owner of this website. He has been selling homes in MA for buyers and sellers for over 20 years. He is an expert in foreclosure purchases, short-sale purchases, short-sale sales, buy and hold investing, fix and flip investing, and of course traditional residential home sales. He is happy to take questions as they pertain to real estate on Title V, Radon, Termites, Sump Pumps, Roofs, Foundations, Wells, Septic Systems, Cash-Flow, Staging, and a host of other housing issues. As a Vanderbilt University alumnus, he is proud to serve his local community.

*All information is posted in good faith and is assumed to be reliable, but may rely on third party information sources.

Posted in Millis, MA
March 31, 2019

Milford, MA Home Sales and Real Estate Market Report (2019)

March

The Milford Homes For Sale Market Report

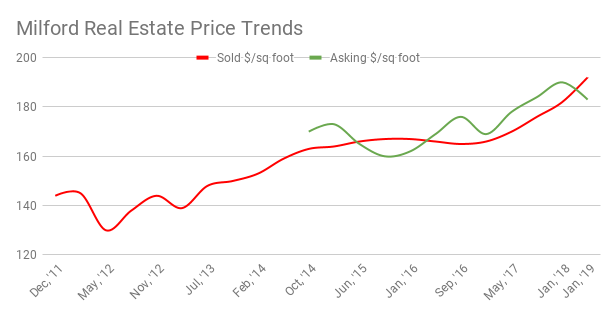
The Milford chart looks very different from Medfield.  Just about the time prices stopped going up in Medfield, they started a new surge in Milford.  In Milford, affordability is much less of an issue, with prices still under $200/ sq foot, not the $300 they are getting in the more expensive areas. 

Can’t see the chart? You can find it Here .

In this case, the lack of inventory is having an effect on prices.  While the HSI remains above 300, we'll probably continue to see rising prices this year.  

What should potential home buyers do in Milford?

Home buyer in Milford will see lots of competition, so know what you want and examine things closely first go around - you won't get a second look.  And if you can, examine properties that need a lot of work - they are selling below where they should, so there's equity opportunities there.

Find Your Next Home or Check out the Competition!

What should future home sellers do in Milford?

The home selling is easy in Milford.  It's find a place to go that's tough!  

Milford Homes For Sale and Sold Market Statistics - MLS Data

  • The Milford “Home Seller Index” (HSI): 330 Last Report:391
  • There are 20 homes currently listed as For Sale by Home Sellers.
  • In Milford there have been 153 houses sold in the last 6 months, and 81 homes sold in the last 3 months.
  • The Average number of Days on Market (DOM) was 30 days for the last 6 months of SOLD homes In Milford.
  • Homes for sale have been looking for buyers for an average of 102 days (the homes currently for sale).
  • The amount that was paid by Home buyers in Dollars per Sq. Ft. averaged 192 (vs. 182 in the last report)
  • Current home sellers are looking for $ 183 /sq foot
  • There was an Average Sold Price of $365,413 .
  • Milford, MA, has 0 properties advertised as lender owned or foreclosure (typically foreclosure) .
  • There are 0 properties advertised as a short-sale is going to be needed by the lender.

All raw data are for Single Family Houses and based on data in MLS. Matt’s HSI is proprietary*, and is designed to offer town-by-town information, instead of large scale trends. *That means you won’t find it anywhere else. Take that, Case-Schilling!.

An Educated Home Buyer is a Happy Home Owner. Read On!

About Matt Heisler

Matt Heisler is a real-estate professional and owner of this website. He has been selling homes in MA for buyers and sellers for over 20 years. He is an expert in foreclosure purchases, short-sale purchases, short-sale sales, buy and hold investing, fix and flip investing, and of course traditional residential home sales. He is happy to take questions as they pertain to real estate on Title V, Radon, Termites, Sump Pumps, Roofs, Foundations, Wells, Septic Systems, Cash-Flow, Staging, and a host of other housing issues. As a Vanderbilt University alumnus, he is proud to serve his local community.

*All information is posted in good faith and is assumed to be reliable, but may rely on third party information sources.

Posted in Milford, MA
March 30, 2019

Medfield, MA Home Sales and Real Estate Market Report (2019)

March

The Medfield Homes For Sale Market Report

Here in Medfield, an expensive town in my area, as it lies closer to Boston, we see that prices are having trouble moving up.  After a great run, moving from 220 to 280, they remain about where they were for the past 2 years.  Sellers expectations have come down - and stay down.  

So what's up in Medfield?  Well this report shows that there is a limit to the affordability of housing, and this part of Massachusetts has been bumping up against that limit.  With a limit to the number of buyers that can pay $300/ sq foot, and those buyers having options elsewhere, they are either choosing to get less in other towns or choosing to pay less in other towns.  Either way - Medfield has been capped out, and it'll stay that way until there's more demand, which could happen with rising prices to the east, or continued falling supply.

Can’t see the chart? You can find it Here .

That won't be easy though -supply remains at record lows. The market is as good for sellers as ever - but the prices rises aren't happening.  In fact, if you look at the data, there's some signs there that we are topping out.  Average sale price dropped - showing that the lower stuff is moving quicker than the higher priced stuff - and the current average days on market for actives is 120 days - not the 75 we are used to seeing.  

What should potential home buyers do in Medfield ?

Recognize that there is softness in the upper levels of the market.  More sellers than buyers.  Lots of competition in the lower levels however. 

Find Your Next Home or Check out the Competition!

What should future home sellers do in Medfield ?

Some parts of the market are competitive, and if your home isn't priced right, you're going to sit - potentially for months.  Some luxury homes will find the demand very soft.  Be smart about how you evaluate your competition - it's not just in Medfield. 

Medfield Homes For Sale and Sold Market Statistics - MLS Data

  • The Medfield “Home Seller Index” (HSI):228 Last Report:228
  • There are 19 homes currently listed as For Sale by Home Sellers.
  • In Medfield there have been 99 houses sold in the last 6 months, and 46 homes sold in the last 3 months.
  • The Average number of Days on Market (DOM) was 45 days for the last 6 months of SOLD homes In Medfield .
  • Homes for sale have been looking for buyers for an average of 125 days (the homes currently for sale).
  • The amount that was paid by Home buyers in Dollars per Sq. Ft. averaged 279 (vs. 285 in the last report)
  • Current home sellers are looking for $ 313 /sq. foot
  • There was an Average Sold Price of $719,361 .
  • Medfield , MA, has 0 properties advertised as lender owned or foreclosure (typically foreclosure) .
  • There are 0 properties advertised as a short-sale is going to be needed by the lender.

All raw data are for Single Family Houses and based on data in MLS. Matt’s HSI is proprietary*, and is designed to offer town-by-town information, instead of large scale trends. *That means you won’t find it anywhere else. Take that, Case-Schilling!.

An Educated Home Buyer is a Happy Home Owner. Read On!

About Matt Heisler

Matt Heisler is a real-estate professional and owner of this website. He has been selling homes in MA for buyers and sellers for over 20 years. He is an expert in foreclosure purchases, short-sale purchases, short-sale sales, buy and hold investing, fix and flip investing, and of course traditional residential home sales. He is happy to take questions as they pertain to real estate on Title V, Radon, Termites, Sump Pumps, Roofs, Foundations, Wells, Septic Systems, Cash-Flow, Staging, and a host of other housing issues. As a Vanderbilt University alumnus, he is proud to serve his local community.

*All information is posted in good faith and is assumed to be reliable, but may rely on third party information sources.

Posted in Medfield, MA