General Index 

General House Hunting Articles

Things about Housing Everyone Should Know

Good Towns for Buyers, Good Towns for Sellers

Home Buying, Step by Step

Common Housing Problems and What to Do

Financing

Common Expenses when Buying or Selling Homes

After You Move In

Remodeling Slideshows for Kitchens, Baths, and others!

Newsletters

May 31, 2017

How to Sell Income Property- Avoid these Common Mistakes when Listing

The Top Things you Must Do When Selling Income Property

The worst part about finding property for investors is that many of the listings agents don't do what they should for selling income property.  Let's look at some very common mistakes that lots of others make. 


  1. No Pictures.  You need to have pictures today to draw traffic, and traffic is offers.  I know what you're saying, "But it looks terrible inside!".  Sure.  I'm sure it does.  But without pictures you'll get buyers who aren't ready to fix it up, and they walk in, and walk out.  Real estate listings aren't cracker jacks - there's not supposed to be a "surprise inside".  You're just wasting everyone's time, and your money.
  2. No expense data.  The more you reveal about expense data, the better it is for you.  I know - you don't want to reveal it.  But when it's not there, your perspective buyer is going to ASSUME what the expense is.  Then he's going to double that number, to make sure he doesn't get burned.  Everytime he adds $1000, it costs you $10,000.  This is a killer, everytime.
  3. No heating unit info.  Separating the heat is a big job, and you need to tell the buyer if you've done it or not.
  4. No Rental information.  Really?   It's called income property and you're going to make them guess at the income?  If the rents are low, raise 'em up.  If that makes the tenants move out, good cause....
  5. Sell with no tenants.  There are so many advantages to selling a building with no tenants.  The buyers can SEE it.  You can CLEAN it.  It can be shown on short notice.  Even good tenants have been known to change the locks and not be around or not let people in.  They know if the building sells, they either have to move or pay more rent - so don't expect them to help you.  I know, you want to collect rent for as long as possible, but having tenants in place will cost you 3-5% of Gross Sale Price for an average building.  2 months of rental income isn't worth that.

How Not to Sell an Income Property

Top Things to Remember When You are Marketing Rental Property

  1. Your best buyer is an educated buyer.  The more he believes in the financials of the building -expenses, rents, etc. the more he will be willing to pay.  It's math to an investor, help him do the math.
  2. Pictures, pictures.  It works for homes, and it works for income property.  Plain and simple.
  3. Facilitate the sale.  Investors don't have a lot of time.  Don't restrict the showings because tenants are there, or with accompanied showings.  Response time is critical for these buyers. 
  4. Identify updates to infrastructure.  Again, it's a math problem.  If the investor guesses - he won't guess in your favor.

These items will make your sale faster and for more money!  Don't end up on the bad MLS listing list!  

An Educated Home Buyer is a Happy Home Owner. Read On!

About Matt Heisler

Matt Heisler is a real-estate professional and owner of this website. He has been selling homes in MA for buyers and sellers for over 20 years. He is an expert in foreclosure purchases, short-sale purchases, short-sale sales, buy and hold investing, fix and flip investing, and of course traditional residential home sales. He is happy to take questions as they pertain to real estate on Title V, Radon, Termites, Sump Pumps, Roofs, Foundations, Wells, Septic Systems, Cash-Flow, Staging, and a host of other housing issues. As a Vanderbilt University alumnus, he is proud to serve his local community.

*All information is posted in good faith and is assumed to be reliable, but may rely on third party information sources.

May 29, 2017

Real Estate Sales for Millis, MA - Home Sales and Real Estate Market Report (2017)

May

The Millis Homes For Sale Market Report

Millis - far smaller than Milford, our last report - has almost as many houses for sale.  That's pretty shocking.  Why?  Because the sellers are asking much more than buyers are willing to pay.  Look at the gap between asking and getting in the chart below.  It's $50 a square foot! 


Home Buyers mostly haven't been fooled - they are moving up, but slowly - not at the rapid pace the home sellers are looking to get. 

Can’t see the chart? You can find it Here .

The transaction level in Millis is holding even, not falling like we are seeing in many towns.   The HSI remains strong, and it is a good time to sell in Millis, just not as good as most of the home sellers would like!! 

What should potential home buyers do in Millis?

Home buyers need to be wary - some home prices are out of whack!  Don't rely on an appraiser to bail you out, in a small town like Millis, there's not enough data for many houses and house types.  Appraisers have a lot of rules to follow, and that can result in an accurate application of the rules - with an inaccurate result.

Find Your Next Home or Check out the Competition!

What should future home sellers do in Millis?

If I were a Millis home seller, I would reach for a price - but not like the others!  I'd want to look cheap compared to what's out there - and expensive to what just sold.  I might just get it!! 

Millis Homes For Sale and Sold Market Statistics - MLS Data

  • The Millis “Home Seller Index” (HSI): 216 Last Report: 210
  • There are 17 homes actively listed as For Sale for Home Buyers.
  • In Millis there have been 74 houses sold in the last 6 months, and 79 homes sold in the last 3 months.Cementary
  • The Average number of Days on Market was 43 days for recently SOLD homes In Millis.
  • Homes for sale have been sitting for an average of 86 days homes For Sale (currently for sale).
  • The amount that was paid by Home buyers in Dollars per Sq. Ft. averaged $217 (vs. $206 in the last report)
  • Current home sellers are looking for $269 /sq foot
  • There was an Average Sold Price of $454,793 .
  • Millis, MA, has 1 properties advertised as lender owned or foreclosure (typically foreclosure) .
  • There are 1 properties advertised as a short-sale is going to be needed by the lender.

All raw data are for Single Family Houses and based on data in MLS. Matt’s HSI is proprietary*, and is designed to offer town-by-town information, instead of large scale trends. *That means you won’t find it anywhere else. Take that, Case-Schilling!.

An Educated Home Buyer is a Happy Home Owner. Read On!

About Matt Heisler

Matt Heisler is a real-estate professional and owner of this website. He has been selling homes in MA for buyers and sellers for over 20 years. He is an expert in foreclosure purchases, short-sale purchases, short-sale sales, buy and hold investing, fix and flip investing, and of course traditional residential home sales. He is happy to take questions as they pertain to real estate on Title V, Radon, Termites, Sump Pumps, Roofs, Foundations, Wells, Septic Systems, Cash-Flow, Staging, and a host of other housing issues. As a Vanderbilt University alumnus, he is proud to serve his local community.

*All information is posted in good faith and is assumed to be reliable, but may rely on third party information sources.

Posted in Millis, MA
May 27, 2017

Real Estate Sales for Milford, MA - Home Sales and Real Estate Market Report (2017)

May

The Milford Homes For Sale Market Report

For home sellers in Milford, everything looks awfully good.  Prices continue to head up, and home sellers aren't being unreasonable - in fact, they should probably be more aggressive.  Let's look at the details to see why.


Can’t see the chart? You can find it Here .

Even though the HSI hasn't moved up much, it's near it's high, well above 225, which shows a market under pressure.  But to me, some of the data shows that home sellers aren't being aggressive enough with prices, especially when I look at the average list time.  It's just 32 Days, and it should probably be closer to 50 or 60.  When things are selling that fast - and literally no one has been sitting on the market - that the's time for the nicer properties to start pushing things up.  Home sellers are moving  up - but not very fast - and they remain close to where the buyers are happy to pay. 

What should potential home buyers do in Milford?

Prices are reasonable here, and the market isn't overheated.  Know your price levels and be willing to reach for top properties if they go competitive (and they probably will). 

Find Your Next Home or Check out the Competition!

What should future home sellers do in Milford?

Home sellers should reach for a price - if they have a property with relatively few issues.  This market can support reach pricing for the right properties. 

Milford Homes For Sale and Sold Market Statistics - MLS Data

  • The Milford “Home Seller Index” (HSI):277  Last Report: 268
  • There are 27 homes actively listed as For Sale for Home Buyers.
  • In Milford there have been 154 houses sold in the last 6 months, and103 homes sold in the last 3 months.
  • The Average number of Days on Market was 34 days for recently SOLD homes In Milford.
  • Homes for sale have been sitting for an average of 32 days homes For Sale (currently for sale).
  • The amount that was paid by Home buyers in Dollars per Sq. Ft. averaged $170 (vs. $166 in the last report)
  • Current home sellers are looking for $178 /sq. foot
  • There was an Average Sold Price of $323,736 .
  • Milford , MA, has 1 properties advertised as lender owned or foreclosure (typically foreclosure) .
  • There are 1 properties advertised as a short-sale is going to be needed by the lender.

All raw data are for Single Family Houses and based on data in MLS. Matt’s HSI is proprietary*, and is designed to offer town-by-town information, instead of large scale trends. *That means you won’t find it anywhere else. Take that, Case-Schilling!.

An Educated Home Buyer is a Happy Home Owner. Read On!

About Matt Heisler

Matt Heisler is a real-estate professional and owner of this website. He has been selling homes in MA for buyers and sellers for over 20 years. He is an expert in foreclosure purchases, short-sale purchases, short-sale sales, buy and hold investing, fix and flip investing, and of course traditional residential home sales. He is happy to take questions as they pertain to real estate on Title V, Radon, Termites, Sump Pumps, Roofs, Foundations, Wells, Septic Systems, Cash-Flow, Staging, and a host of other housing issues. As a Vanderbilt University alumnus, he is proud to serve his local community.

*All information is posted in good faith and is assumed to be reliable, but may rely on third party information sources.

Posted in Milford, MA
May 22, 2017

Freakonomics Revisted - One Agents Take On Realty Data Explored

The Freakonomics Summary


I'll pass along this link, currently active without paywall at the NY Times.  I think it presents a short, but balanced summary of Stephen Levitt's study on the behavior of real estate agents selling their own homes vs. the homes they represent.  In short, here are Levitt's conclusions via the data.

  • Real estate agents had their home on the market 9.5 days longer than non real-estate agent owned homes
  • They received prices that were 3.7% higher than non real-estate agent owned homes

Professor Levitt than goes on to speculate why this would be so!  And his rationale is (again, paraphrasing) this:


  • Real estate agents, due to the structure of their commission, aren't completely aligned with a home seller's desire to maximize price. As such, some home sellers will receive less then they could.


It should be noted that the post and the study were before 2005 - when the market was hot, much like it is now.  Also, all the data came from the Chicago area - a relatively inexpensive part of the country - and I'd be interested to see if the trend was consistent in more competitive areas.


The Freakonomics Results - More Detailed Theories

I find the data interesting, but the theorizing behind why the data looks like it does is not complete.  On it's surface, Professor Levitt's conclusion about the alignment of the commission contract and and seller's desire to maximize price is completely correct.  However, it doesn't have very much to do with "incremental commission" which is what he suggests.  And now, if you've bared with me this long, we'll get to the fun part of the post.  Here are some of my thoughts on things that haven't been adequately explored in this area.

Maximizing Price isn't Really the Goal

When you hire me to sell your home, it goes unspoken, many times, that the goal is to get the best price.  But there are actually two goals.  1) Get the best price.  2) Sell the home.

It turns out that #1 is  not the primary goal!  Selling the home is.  The Freakonomics material overlooks this very basic point, and they aren't alone. Many sellers forget this, as obvious as it sounds, until they are on the market for a month and the showings start drying up.  Very quickly, the conversations go from "how can we get a higher price?" to "how can we get an offer?".  If you change what the goal often is, you're changing the advice you get - and the behavior that will likely follow. 

As agents, we know how quickly things can turn.  When a house doesn't sell quickly, especially in a good market, home sellers get frustrated fast. Since all agents have seen it happen, we are more likely to encourage attractive market prices to avoid a negative experience.  

Penalties of Failure

One of my main criticisms of the Freakonomics rationale for the data set is no discussion (that I see cited anywhere) about the disproportionate penalty that real estate agents have for not selling a house.  It turns out, that if you're an agent, even the best ones, they don't sell every house.  There are many reasons for this, but any experience agent knows that the ones you don't sell have all sorts of "penalties" associated with them. 

1) No referrals.  If you don't sell someone's house, they are unlikely to refer you to someone else.  Since this is often 70-80% of new business, each house you don't sell has wide effects, that can hurt your business for years.  And this is assuming you don't get any "bad press", which you most certainly will.

2) Out costs

It costs money to list a home, and usually the agent fronts it.  We don't get paid back for the money we have spent when it doesn't sell.

3) Out time

The homes that don't sell paradoxically take up the most time! Agents don't get paid for that time either - it's a sunk cost. The New York Time article, like most, are happy to point out the commission an agent gets "for a few hours of work*" but the truth is agents bear the costs on all houses listed - not just the ones that sell.

As you can see, from an agent's perspective, the costs of not selling the home are great.  I'll be the first to admit, the costs are so great agents are incentivized to make sure the home sells. This is largely what the data suggests, but I would argue that the main reasons that agents list their homes longer and sell for more is that on their own homes, there is no risk of them getting fired and not selling the home. After all, you're not going to fire yourself!  However, when we work for others, we have a very real risk of getting terminated - and paying all the penalties associated with the failure to sell the house.  What I'd really like to see, if we're going to talk about how real estate agent contract works, is what happens if you can't fire them?  If you promise - no matter what - to list the house with them until it sells?  I'd be willing to bet that the data would no longer be very interesting, because the real penalty has been taken away.  

Risk Tolerance

An experienced agent who has sold dozens or hundred of properties isn't going to look at the real estate sales process the same way as someone who is selling their home for the first time in 10 years.  This manifests itself in many different ways, all of which are likely to have small impacts that can add up.  The easiest way to look at an element of it is in negotiating.  If I'm negotiating a deal for clients, oftentimes their risk tolerance isn't the same as mine, or similar to what I might do personally.  It easier for an agent to drive a hard bargain because if the deal fall apart, they have no one to blame but themselves - and so they go back to the drawing board.  But if you drive a hard bargain with your client and the deal falls apart, the agent is going to get blamed.  Again, this is because the vast majority of home sellers care far more about selling the home than getting top dollar (there are exceptions!).  When they find out the buyer has walked away from the transaction over a few thousand dollars they would have conceded on, that is a failure of negotiating, and the agent is going to take the fall.

Benefits of Success

Along with the penalties of failure, comes the warm embrace of success.  By and large, home sellers who sell quickly are very happy with their agent. They refer them to others, offer warm endorsements, and are likely to use them the next time they need to buy or sell.  This behavior is irrespective of price!  Again, the lesson here is that price maximization isn't the primary goal.  The way home sellers behave before, during and after the transaction all reinforce the behavior of the agent around the true goal - getting the home sold.

Successful Dialog With Your Agent

None of this is to suggest that by listing with an agent that you are automatically not going to price maximize.  But you should have clear conversations with your agent about your risk tolerance and your goals for price maximization - don't leave it unspoken.  Good agents have no trouble pointing out that the goal at one price-level is to sell "first week", at another price-point is to sell "quickly", and the goal at a higher price level is to test the market - and may not work.  If you decide on a higher price point, make sure you've discussed how long you will wait, how many showings you will entertain, and how much the first price cut will be, as part of an advanced plan to get the home back to where it likely needs to be. Remember, most houses (80-90%) that test new price levels in a market fail, even in good markets. The time before you list, when you have time to think, and can be dispassionate, is the right time to discuss strategy and pricing, the wrong time is 2 months after it was listed. 


*Don't get me started.


An Educated Home Buyer is a Happy Home Owner. Read On!

About Matt Heisler

Matt Heisler is a real-estate professional and owner of this website. He has been selling homes in MA for buyers and sellers for over 20 years. He is an expert in foreclosure purchases, short-sale purchases, short-sale sales, buy and hold investing, fix and flip investing, and of course traditional residential home sales. He is happy to take questions as they pertain to real estate on Title V, Radon, Termites, Sump Pumps, Roofs, Foundations, Wells, Septic Systems, Cash-Flow, Staging, and a host of other housing issues. As a Vanderbilt University alumnus, he is proud to serve his local community.

*All information is posted in good faith and is assumed to be reliable, but may rely on third party information sources.

May 20, 2017

Real Estate Sales for Medfield, MA - Home Sales and Real Estate Market Report (2017)


May

The Medfield Homes For Sale Market Report

As we move through the reports, we are seeing a number of similarities in the charts.  Here's the pricing chart in Medfield, and on this chart we can see that Home Prices are about the same as they were 2 years ago.  Medfield is an expensive town, and the affordability has put a cap on prices.  Sellers were asking well over $320/ sq foot just  a few months ago, and have been very optimistic for a year plus.  But home buyers aren't going crazy, they are staying at a point that they think works.

Can’t see the chart? You can find it Here .

We can really see some of the inner workings here.  It is May, but we're seeing a sharp surprise in active properties, and a sharp decrease in the HSI.  Listen, the HSI is still in the 170's - the sky isn't falling - but if you think the real estate market is going to keep going straight up, this chart and data - going a year back - shows that there are some real resistance areas popping up, and things probably are going to go up far slower from this point on.

What should potential home buyers do in Medfield?

I think home buyers in Medfield have been smart and rational - they are clearly shopping multiple towns and and finding the best value proposition, while by and large, staying out of price wars and crazy over bidding.  That stuff is happening - but not on every house - and the buyers commitment to price levels is evidence. 

Find Your Next Home or Check out the Competition!

What should future home sellers do in Medfield?

If I was a home seller, I'd be careful about asking too much.  That has been a poor strategy, and it doesn't look like it's going to get better.  Good, accurate pricing, as always, is likely to net you the best and fastest result.

Medfield Homes For Sale and Sold Market Statistics - MLS Data

  • The Medfield “Home Seller Index” (HSI): 170 Last Report: 203
  • There are 49 homes actively listed as For Sale for Home Buyers.
  • In Medfield there have been 102 houses sold in the last 6 months, and 74 homes sold in the last 3 months.
  • The Average number of Days on Market was 35 days for recently SOLD homes In Medfield.
  • Homes for sale have been sitting for an average of 70 days homes For Sale (currently for sale).
  • The amount that was paid by Home buyers in Dollars per Sq. Ft. averaged $277 (vs. $265 in the last report)
  • Current home sellers are looking for $307 /sq. foot
  • There was an Average Sold Price of $693,375 .
  • Medfield, MA, has 0 properties advertised as lender owned or foreclosure (typically foreclosure) .
  • There are 0 properties advertised as a short-sale is going to be needed by the lender.

All raw data are for Single Family Houses and based on data in MLS. Matt’s HSI is proprietary*, and is designed to offer town-by-town information, instead of large scale trends. *That means you won’t find it anywhere else. Take that, Case-Schilling!.

Other Posts You Might Enjoy

About Matt Heisler

Matt Heisler is a real-estate professional and owner of this website. He has been selling homes in MA for buyers and sellers for over 20 years. He is an expert in foreclosure purchases, short-sale purchases, short-sale sales, buy and hold investing, fix and flip investing, and of course traditional residential home sales. He is happy to take questions as they pertain to real estate on Title V, Radon, Termites, Sump Pumps, Roofs, Foundations, Wells, Septic Systems, Cash-Flow, Staging, and a host of other housing issues. As a Vanderbilt University alumnus, he is proud to serve his local community.

*All information is posted in good faith and is assumed to be reliable, but may rely on third party information sources.

Posted in Medfield, MA
May 8, 2017

Real Estate Sales for Marlborough, MA - Home Sales and Real Estate Market Report (2017)

May

The Marlborough Homes For Sale Market Report

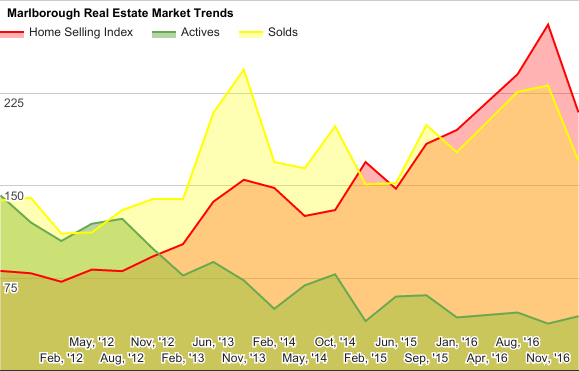
Marlborough and Hudson usually look pretty similar, and they do again.  Prices moving sharply upward, with huge jumps since 2013.  It's been steady, and it demonstrates the lack of affordability in many of the surrounding towns, pushing more and more people further West.  

This is not  a new trend!  Prices, in general, in Massachusetts, rise in the east, closer to Boston first, and then as the cycle lengthens, prices move higher out west. Tracking this price lag is what we're all about here on the blog. 

Can’t see the chart? You can find it Here .

What should potential home buyers do in Marlborough?

Just like in Hudson, buyers in Marlborough should be looking at multiple towns.  Marlborough and Hudson have both played "catch-up" and are no longer the screaming good deals they were before 2013.  

Find Your Next Home or Check out the Competition!

What should future home sellers do in Marlborough?

I would say the future is now for Home Sellers in Marlborough, assuming the opportunity to go elsewhere - with less demand in that location - is available.  With interest rates on the rise, it won't be long before prices stop going up.  I'm not saying they are going to go down - not yet- but the years of 5-8% jumps in prices are ending, if they haven't already.  By this time in 2018, I expect to be seeing inventory rises across many of the towns - and either price stabilization or some softening. 

Marlborough Homes For Sale and Sold Market Statistics - MLS Data

  • The Marlborough “Home Seller Index” (HSI): 209 Last Report:280
  • There are 44 homes actively listed as For Sale for Home Buyers.
  • In Marlborough there have been 170 houses sold in the last 6 months, and 123 homes sold in the last 3 months.
  • The Average number of Days on Market was 41 days for recently SOLD homes In Marlborough.
  • Homes for sale have been sitting for an average of 63 days homes For Sale (currently for sale).
  • The amount that was paid by Home buyers in Dollars per Sq. Ft. averaged $197 (vs. $190 in the last report)
  • Current home sellers are looking for $209 /sq foot
  • There was an Average Sold Price of $352,038 .
  • Marlborough, MA, has 2 properties advertised as lender owned or foreclosure (typically foreclosure) .
  • There are 0 properties advertised as a short-sale is going to be needed by the lender.

All raw data are for Single Family Houses and based on data in MLS. Matt’s HSI is proprietary*, and is designed to offer town-by-town information, instead of large scale trends. *That means you won’t find it anywhere else. Take that, Case-Schilling!.

Other Posts You Might Enjoy

About Matt Heisler

Matt Heisler is a real-estate professional and owner of this website. He has been selling homes in MA for buyers and sellers for over 20 years. He is an expert in foreclosure purchases, short-sale purchases, short-sale sales, buy and hold investing, fix and flip investing, and of course traditional residential home sales. He is happy to take questions as they pertain to real estate on Title V, Radon, Termites, Sump Pumps, Roofs, Foundations, Wells, Septic Systems, Cash-Flow, Staging, and a host of other housing issues. As a Vanderbilt University alumnus, he is proud to serve his local community.

*All information is posted in good faith and is assumed to be reliable, but may rely on third party information sources.

Posted in Marlborough, MA
April 28, 2017

How can you buy a property in auction when you don't have the cash?

How can you buy a property in auction when you don't have the cash?


In real estate, like other industries, sometimes the vocabulary gets in the way.  It is not uncommon for many real estate advertisements to say "cash only".  Sometimes, that means what it says, but most of the time it doesn't!  Let's look at this a bit more closely.

Basic Home Auction Goals

One of the main goals of an auction is sell the house quickly.  Not for the most money, but QUICKLY.  It take time to get a mortgage, and the buyer could get turned down for a mortgage, and if that happens, the house will have to get sold again.  To prevent this process from happening, some auctions are cash only auctions.  The goal would be that sale will be quick, and there will be no mortgage condition that protects the buyers money.  This allows for fast transactions - and a quick asset sale.

Borrowing Money For an Auction

If you need to borrow money for an auction, you can still make a cash deal (banks don't usually verify assets, but always check to see if they are, or aren't.).  Generally, if you can:

a) Make the deposits required

b) Close quickly

c) Sign the contract without a mortgage contingency

The bank will go ahead and do the deal.  You'll need to be very sure that you can get the mortgage when you think you can, otherwise you will lose your deposits.


How Can I get Money Quickly for An Auction Purchase?

Generally, there are lots of ways to borrow money!  Here are some.

1) Banks.  Banks offer the lowest rates, but can be the slowest, and most careful.  They don't lend money to everyone, and don't lend unlimited amounts, and they are very careful about who they lend to.

2) Hard-money Lenders: These are people who can lend money, but are less careful about who they lend to.  However, their rates are often the highest.  

3) Crowdsourcing: There are new "internet lenders" who use crowdsourcing as a source of hard money.  It is hard to know how this will evolve, but right now, they are similar to the internet version of hard-money lenders

4) Friends and Family.  Not recommended!  But many people get started in business/real estate  through this funding source.


Should you Borrow Money For an Auction?


If you are willing to risk loss of your deposits, AND you believe you can close quickly to prove it, AND the bank won't require verification of funds, then sure, go ahead and borrow!  It is a very, very risky way to purchase property, but if you have the right connections and a strong stomach, go right ahead.

Other Posts You Might Enjoy

About Matt Heisler

Matt Heisler is a real-estate professional and owner of this website. He has been selling homes in MA for buyers and sellers for over 20 years. He is an expert in foreclosure purchases, short-sale purchases, short-sale sales, buy and hold investing, fix and flip investing, and of course traditional residential home sales. He is happy to take questions as they pertain to real estate on Title V, Radon, Termites, Sump Pumps, Roofs, Foundations, Wells, Septic Systems, Cash-Flow, Staging, and a host of other housing issues. As a Vanderbilt University alumnus, he is proud to serve his local community.

*All information is posted in good faith and is assumed to be reliable, but may rely on third party information sources.

April 22, 2017

Real Estate Sales for Hopkinton, MA - Home Sales and Real Estate Market Report (2017)


March

The Hopkinton Homes For Sale Market Report

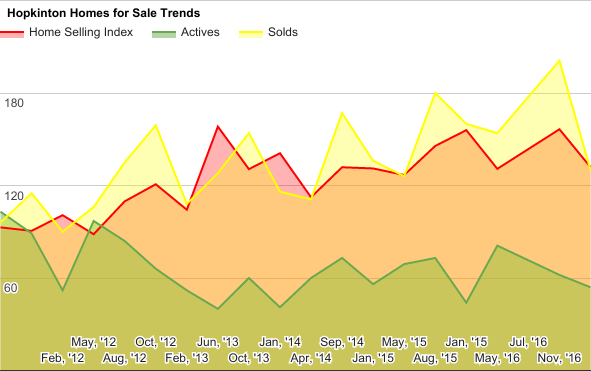
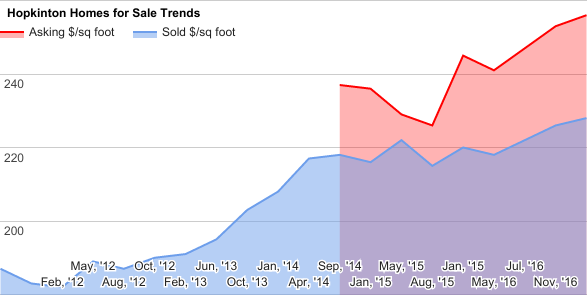
Here in Hopkinton, we can really see the opposing forces in this season's market.  Sellers are staying expensive, hoping for a desperate buyer, and the buyers are moving up - but very slowly.  If we look at the more detail data, we see some other things as well. 

Can’t see the chart? You can find it Here .

In the chart below, we see inventory pressures - not many homes to buy - consistent with the past few years.  But look at the drop in transactions.  To me, that suggests either buyers don't like the prices in Hopkinton - and are going elsewhere  - or there's nothing to buy (which is certainly a component).  It may mean, though, there are simply fewer buyers, and that is something I am watching very closely.

What should potential home buyers do in Hopkinton?

Home buyers don't have much choices, but many current sellers have been on for 5 months or more - so they may be pretty desperate for an offer.  They are overpriced, but if you can get them down where they need to be, it's a win for everyone.

Find Your Next Home or Check out the Competition!

What should future home sellers do in Hopkinton?

Home sellers will find a receptive market when priced right.  Most sellers aren't though, and the buyers are showing that they won't nibble if you're too high.  

Hopkinton Homes For Sale and Sold Market Statistics - MLS Data

  • The Hopkinton “Home Seller Index” (HSI): 132 Last Report:156
  • There are 54 homes actively listed as For Sale for Home Buyers.
  • In Hopkinton there have been 130 houses sold in the last 6 months, and 78 homes sold in the last 3 months.
  • The Average number of Days on Market was 72 days for recently SOLD homes In Hopkinton.
  • Homes for sale have been sitting for an average of 198 days homes For Sale (currently for sale).
  • The amount that was paid by Home buyers in Dollars per Sq. Ft. averaged $228 (vs. $226 in the last report)
  • Current home sellers are looking for $256 /sq foot
  • There was an Average Sold Price of $583,740 .
  • Hopkinton, MA, has 1 properties advertised as lender owned or foreclosure (typically foreclosure) .
  • There are 2 properties advertised as a short-sale is going to be needed by the lender.

All raw data are for Single Family Houses and based on data in MLS. Matt’s HSI is proprietary*, and is designed to offer town-by-town information, instead of large scale trends. *That means you won’t find it anywhere else. Take that, Case-Schilling!.

Other Posts You Might Enjoy

About Matt Heisler

Matt Heisler is a real-estate professional and owner of this website. He has been selling homes in MA for buyers and sellers for over 20 years. He is an expert in foreclosure purchases, short-sale purchases, short-sale sales, buy and hold investing, fix and flip investing, and of course traditional residential home sales. He is happy to take questions as they pertain to real estate on Title V, Radon, Termites, Sump Pumps, Roofs, Foundations, Wells, Septic Systems, Cash-Flow, Staging, and a host of other housing issues. As a Vanderbilt University alumnus, he is proud to serve his local community.

*All information is posted in good faith and is assumed to be reliable, but may rely on third party information sources.

Posted in Hopkinton MA
April 14, 2017

Real Estate Sales for Holliston, MA - Home Sales and Real Estate Market Report (2017)


March

The Holliston Homes For Sale Market Report

Well, we didn't see any pull back in prices this fall, and the home sellers are out sharply higher setting new targets.  I think they are a bit optimistic, but they often are this time of year!

Can’t see the chart? You can find it Here .

What should potential home buyers do in Holliston ?

Home buyers will find the selection thin - it's near our tracking lows - and buyers will be thick in certain price ranges.  What's out there is a reach over last year - be careful!

Find Your Next Home or Check out the Competition!

What should future home sellers do in Holliston ?

Home sellers should realize that they will get lots of traffic in the first two weeks - and then not so much.  So your home needs to be ready!!  Making it presentable and pricing it right will ensure a quick sale at a high value.  

Holliston Homes For Sale and Sold Market Statistics - MLS Data

  • The Holliston “Home Seller Index” (HSI): 178 Last Report: 192
  • There are 33 homes actively listed as For Sale for Home Buyers.
  • In Holliston there have been 119 houses sold in the last 6 months, and 80 homes sold in the last 3 months.
  • The Average number of Days on Market was 58 days for recently SOLD homes In Holliston.
  • Homes for sale have been sitting for an average of 124 days homes For Sale (currently for sale).
  • The amount that was paid by Home buyers in Dollars per Sq. Ft. averaged $222 (vs.$220 in the last report)
  • Current home sellers are looking for $ 245 /sq. foot
  • There was an Average Sold Price of $484,858 .
  • Holliston , MA, has 0 properties advertised as lender owned or foreclosure (typically foreclosure) .
  • There are 0 properties advertised as a short-sale is going to be needed by the lender.

All raw data are for Single Family Houses and based on data in MLS. Matt’s HSI is proprietary*, and is designed to offer town-by-town information, instead of large scale trends. *That means you won’t find it anywhere else. Take that, Case-Schilling!.

Other Posts You Might Enjoy

About Matt Heisler

Matt Heisler is a real-estate professional and owner of this website. He has been selling homes in MA for buyers and sellers for over 20 years. He is an expert in foreclosure purchases, short-sale purchases, short-sale sales, buy and hold investing, fix and flip investing, and of course traditional residential home sales. He is happy to take questions as they pertain to real estate on Title V, Radon, Termites, Sump Pumps, Roofs, Foundations, Wells, Septic Systems, Cash-Flow, Staging, and a host of other housing issues. As a Vanderbilt University alumnus, he is proud to serve his local community.

*All information is posted in good faith and is assumed to be reliable, but may rely on third party information sources.
Posted in Holliston, MA
April 11, 2017

Real Estate Sales for Grafton, MA - Home Sales and Real Estate Market Report (2017)

March

The Grafton Homes For Sale Market Report

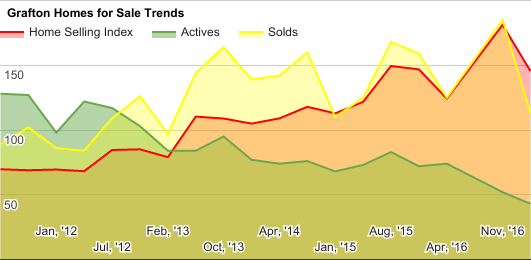
Grafton looks marginally better for home sellers this year.  Nothing drastic.  Despite the significant discount to both Shrewsbury and Westborough prices, Grafton is still a laggard in this market, and fighting to get back to where it was in 2005.  

Can’t see the chart? You can find it Here .

Let's look at the detail data. Inventory continues to drop.  That tells me that prices could be getting ready for a sharp tick upwards.  The HSI is a little muddled because of the High Point Drive new construction - some listings are multi-year listings waiting for a sale.  Once those start moving off, things will probably look quite a bit better. 

What should potential home buyers do in Grafton ?

Well, in some price ranges there are still choices.  There will be bid wars, but they will be scattered around and not everywhere.  Home sellers have largely remained close to where prices are happening, although there was a notable uptick in the last report. 


Find Your Next Home or Check out the Competition!

What should future home sellers do in Grafton ?

Home sellers should maybe wait one more year?  This year will be good, but we still haven't seen the big price jump in Grafton yet.  It's probably coming, but it's been a long wait for many. 

Grafton Homes For Sale and Sold Market Statistics - MLS Data

  • The Grafton “Home Seller Index” (HSI): 145 Last Report:181
  • There are 43 homes actively listed as For Sale for Home Buyers.
  • In Grafton there have been 113 houses sold in the last 6 months, and 63 homes sold in the last 3 months.
  • The Average number of Days on Market was 56 days for recently SOLD homes In Grafton.
  • Homes for sale have been sitting for an average of 421 days homes For Sale (currently for sale).
  • The amount that was paid by Home buyers in Dollars per Sq. Ft. averaged $184 (vs. 181 in the last report)
  • Current home sellers are looking for $ 200  /sq foot
  • There was an Average Sold Price of $390,068 .
  • Grafton , MA, has 1 properties advertised as lender owned or foreclosure (typically foreclosure) .
  • There are 0 properties advertised as a short-sale is going to be needed by the lender.

All raw data are for Single Family Houses and based on data in MLS. Matt’s HSI is proprietary*, and is designed to offer town-by-town information, instead of large scale trends. *That means you won’t find it anywhere else. Take that, Case-Schilling!.

Other Posts You Might Enjoy

About Matt Heisler

Matt Heisler is a real-estate professional and owner of this website. He has been selling homes in MA for buyers and sellers for over 20 years. He is an expert in foreclosure purchases, short-sale purchases, short-sale sales, buy and hold investing, fix and flip investing, and of course traditional residential home sales. He is happy to take questions as they pertain to real estate on Title V, Radon, Termites, Sump Pumps, Roofs, Foundations, Wells, Septic Systems, Cash-Flow, Staging, and a host of other housing issues. As a Vanderbilt University alumnus, he is proud to serve his local community.

*All information is posted in good faith and is assumed to be reliable, but may rely on third party information sources.
Posted in Grafton, MA