General Index 

General House Hunting Articles

Things about Housing Everyone Should Know

Good Towns for Buyers, Good Towns for Sellers

Home Buying, Step by Step

Common Housing Problems and What to Do

Financing

Common Expenses when Buying or Selling Homes

After You Move In

Remodeling Slideshows for Kitchens, Baths, and others!

Newsletters

April 21, 2020

Boylston, MA Home Sales and Real Estate Market Report (April 2020)

The Boylston Mass Homes For Sale Market Report and Statistics

April

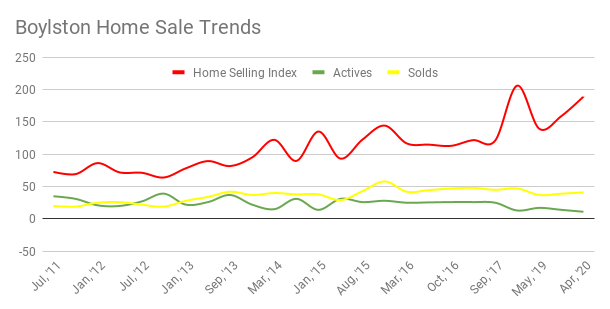
Boylston checks in as one of the more seller optimistic towns we've seen - there's a price level that sellers want, and they are sticking to it.  

Can’t see the chart? You can find it Here .

Buyers, however, remain disciplined, and aren't chasing prices too much. Clearly, some homes are worth chasing, and the buyers are putting those under agreement.  Generally at the lower prices though.
What should potential home buyers do in Boylston?

Home buyers will note it's a quiet market in Boylston, with limited options.  Thus, knowing the market and getting the valuation on the property is good idea quickly - because the best price properties are moving quickly.  Further, note that most properties are coming on overpriced - so be careful about pulling the trigger on the wrong one.

Find Your Next Home or Check out the Competition!

What should future home sellers do in Boylston?

Home sellers should realize that overpricing in this market virtually guarantees a long wait cycle for the right buyer.  Many homes have been on for 3 months - with the wrong price.  If you don't want to wait it out, start smart.

Boylston Homes For Sale and Sold Market Statistics - MLS Data

  • The Boylston “Home Seller Index” (HSI): 189 Last Report: 139
  • There are 11 homes currently listed as For Sale by Home Sellers.
  • In Boylston there have been 41 houses sold in the last 6 months, and 22 homes sold in the last 3 months.
  • The Average number of Days on Market (DOM) was 46 days for the last 6 months of SOLD homes In Boylston.
  • Homes for sale have been looking for buyers for an average of 103 days (the homes currently for sale).
  • The amount that was paid by Home buyers in Dollars per Sq. Ft. averaged 206 (vs.  193 in the last report)
  • Current home sellers are looking for $ 234/sq foot
  • There was an Average Sold Price of $ 532,563  .
  • Boylston, MA, has 0 properties advertised as lender owned or foreclosure (typically foreclosure) .
  • There are 0 properties advertised as a short-sale is going to be needed by the lender.

All raw data are for Single Family Houses and based on data in MLS. Matt’s HSI is proprietary*, and is designed to offer town-by-town information, instead of large scale trends. *That means you won’t find it anywhere else. Take that, Case-Schilling!.

An Educated Home Buyer is a Happy Home Owner. Read On!

About Matt Heisler

Matt Heisler is a real-estate professional and owner of this website. He has been selling homes in MA for buyers and sellers for over 20 years. He is an expert in foreclosure purchases, short-sale purchases, short-sale sales, buy and hold investing, fix and flip investing, and of course traditional residential home sales. He is happy to take questions as they pertain to real estate on Title V, Radon, Termites, Sump Pumps, Roofs, Foundations, Wells, Septic Systems, Cash-Flow, Staging, and a host of other housing issues. As a Vanderbilt University alumnus, he is proud to serve his local community.

*All information is posted in good faith and is assumed to be reliable, but may rely on third party information sources.

Posted in Boylston, MA
April 20, 2020

Berlin, MA Home Sales and Real Estate Market Report (April 2020)

The Berlin Mass Homes For Sale Market Report and Statistics

April

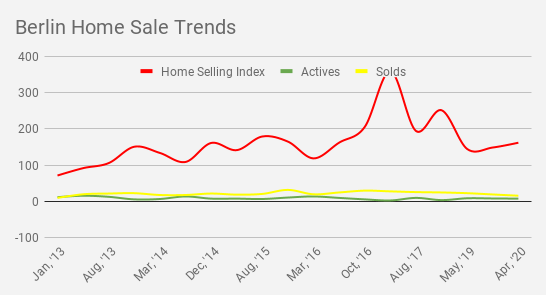
Here again, we have prices moving upward, but the lack of buying pressure has brought sellers down from their loft aspirations of asking prices.

Can’t see the chart? You can find it Here .

The HSI is still good for sellers, but it has fallen sharply from the peak.   This is a trend we have seen in many reports this cycle.

What should potential home buyers do in Berlin?

Home buyers know Berlin is a small town with limited inventory. Note prices are still rising, but the chances of being out bid significantly have fallen.  Properties in good condition move quickly - the rest, not nearly so quickly.

Find Your Next Home or Check out the Competition!

What should future home sellers do in Berlin?

Home sellers need to be aware that the market is rational in Berlin.  Getting lucky isn't a strategy, so make sure you home is price where it needs to be, or the buyers will pass it by.

Berlin Homes For Sale and Sold Market Statistics - MLS Data

  • The Berlin “Home Seller Index” (HSI): 162 Last Report: 145
  • There are 8 homes currently listed as For Sale by Home Sellers.
  • In Berlin there have been 16 houses sold in the last 6 months, and 10 homes sold in the last 3 months.
  • The Average number of Days on Market (DOM) was 38 days for the last 6 months of SOLD homes In Berlin.
  • Homes for sale have been looking for buyers for an average of 39 days (the homes currently for sale).
  • The amount that was paid by Home buyers in Dollars per Sq. Ft. averaged $232 (vs. $205 in the last report)
  • Current home sellers are looking for $ 234 /sq. foot
  • There was an Average Sold Price of $471,659 .
  • Berlin, MA, has 0 properties advertised as lender owned or foreclosure (typically foreclosure) .
  • There are 0 properties advertised as a short-sale is going to be needed by the lender.

All raw data are for Single Family Houses and based on data in MLS. Matt’s HSI is proprietary*, and is designed to offer town-by-town information, instead of large scale trends. *That means you won’t find it anywhere else. Take that, Case-Schilling!.

An Educated Home Buyer is a Happy Home Owner. Read On!

About Matt Heisler

Matt Heisler is a real-estate professional and owner of this website. He has been selling homes in MA for buyers and sellers for over 20 years. He is an expert in foreclosure purchases, short-sale purchases, short-sale sales, buy and hold investing, fix and flip investing, and of course traditional residential home sales. He is happy to take questions as they pertain to real estate on Title V, Radon, Termites, Sump Pumps, Roofs, Foundations, Wells, Septic Systems, Cash-Flow, Staging, and a host of other housing issues. As a Vanderbilt University alumnus, he is proud to serve his local community.

*All information is posted in good faith and is assumed to be reliable, but may rely on third party information sources.
Posted in Berlin, MA
April 18, 2020

Ashland, MA Home Sales and Real Estate Market Report (April 2020)

The Ashland Mass Homes For Sale Market Report and Statistics

April

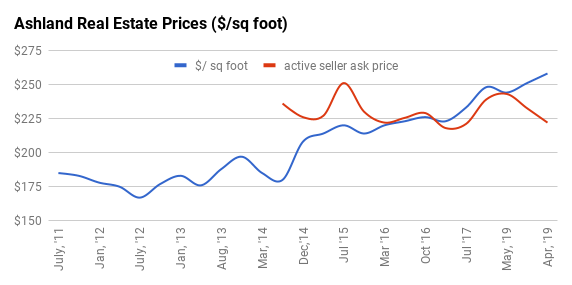
Prices - not inventories - seem to tell the story here.  There's another inverted curve, where the seller asking prices are below the sales prices.  This shows buyers are willing to pay big premiums for homes that don't need work, but are skipping out on properties that do.

Can’t see the chart? You can find it Here .

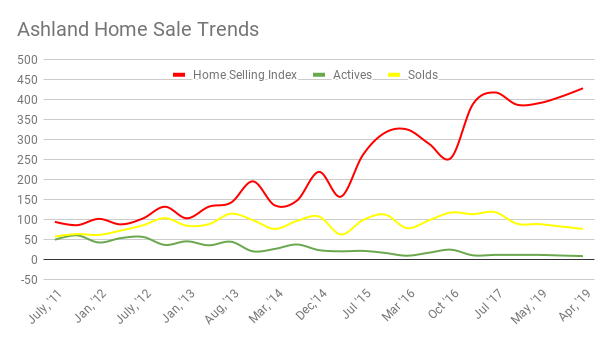
With an HSI above 400, we should see all properties selling and pushing prices up- but that isn't what we see.  Part of the issue is the Ashland market only has about 9 houses for sale at the moment, and that tiny inventory is skewing the data.

What should potential home buyers do in Ashland?

Home buyers should know that homes in good condition are competitively selling, and it can be hard to win those bids by looking at what isn't selling.  Get a look at past sales to understand where the market is at.

Find Your Next Home or Check out the Competition!

What should future home sellers do in Ashland?

Home sellers should do their best to get their home in show condition.  Homes that need work, won't move at premium prices. 

Ashland Homes For Sale and Sold Market Statistics - MLS Data

  • The Ashland “Home Seller Index” (HSI):429  Last Report: 391
  • There are 9 homes currently listed as For Sale by Home Sellers.
  • In Ashland there have been 77 houses sold in the last 6 months, and 42 homes sold in the last 3 months.
  • The Average number of Days on Market (DOM) was 17 days for the last 6 months of SOLD homes In Ashland.
  • Homes for sale have been looking for buyers for an average of 33 days (the homes currently for sale).
  • The amount that was paid by Home buyers in Dollars per Sq. Ft. averaged 258 (vs. 244 in the last report)
  • Current home sellers are looking for $ 222 /sq. foot
  • There was an Average Sold Price of $ 495,630  .
  • Ashland, MA, has 1 properties advertised as lender owned or foreclosure (typically foreclosure) .
  • There are 0 properties advertised as a short-sale is going to be needed by the lender.

All raw data are for Single Family Houses and based on data in MLS. Matt’s HSI is proprietary*, and is designed to offer town-by-town information, instead of large scale trends. *That means you won’t find it anywhere else. Take that, Case-Schilling!.

An Educated Home Buyer is a Happy Home Owner. Read On!

About Matt Heisler

Matt Heisler is a real-estate professional and owner of this website. He has been selling homes in MA for buyers and sellers for over 20 years. He is an expert in foreclosure purchases, short-sale purchases, short-sale sales, buy and hold investing, fix and flip investing, and of course traditional residential home sales. He is happy to take questions as they pertain to real estate on Title V, Radon, Termites, Sump Pumps, Roofs, Foundations, Wells, Septic Systems, Cash-Flow, Staging, and a host of other housing issues. As a Vanderbilt University alumnus, he is proud to serve his local community.

*All information is posted in good faith and is assumed to be reliable, but may rely on third party information sources.
Posted in Ashland, MA
April 16, 2020

Worcester, MA Home Sales and Real Estate Market Report (April 2020)

The Worcester Mass Homes For Sale Market Report and Statistics

April

Worcester by far has one of the healthier charts.  The multi-family chart would look even better, as those properties are seeing the best run maybe ever. It's staying rational too.

Can’t see the chart? You can find it Here .

Again, we see transactions and inventories dropping.  It's hard to know how much of that is COVID related, or simply demand related, because in this city, unlike some others, the DOM shows things are moving quickly.  Note the HSI sets a record, at 250, showing a super competitive market. 

What should potential home buyers do in Worcester?

Home buyers still need to move quickly in this market - the demand is outstripping supply, COVID or not.  It will be harder to assess traffic levels without any open houses (as few agents are doing them), which makes bidding harder!

Find Your Next Home or Check out the Competition!

What should future home sellers do in Worcester ?

Home seller are getting record prices and should think about testing the market even though things are more uncertain.  There will be people who need to move.  But in Worcester, the type of property that you are listing is more relevant to whether that strategy makes sense.  Different property types will benefit from different strategies.  

WorcesterHomes For Sale and Sold Market Statistics - MLS Data

  • The Worcester “Home Seller Index” (HSI): 283 Last Report: 245
  • There are 85 homes currently listed as For Sale by Home Sellers.
  • In Worcester there have been 678 houses sold in the last 6 months, and 354 homes sold in the last 3 months.
  • The Average number of Days on Market (DOM) was 28 days for the last 6 months of SOLD homes In Worcester.
  • Homes for sale have been looking for buyers for an average of 67 days (the homes currently for sale).
  • The amount that was paid by Home buyers in Dollars per Sq. Ft. averaged 182 (vs. 175 in the last report)
  • Current home sellers are looking for $ 194 /sq foot
  • There was an Average Sold Price of $274,829 .
  • Worcester, MA, has 3 properties advertised as lender owned or foreclosure (typically foreclosure) .
  • There are 0 properties advertised as a short-sale is going to be needed by the lender.

All raw data are for Single Family Houses and based on data in MLS. Matt’s HSI is proprietary*, and is designed to offer town-by-town information, instead of large scale trends. *That means you won’t find it anywhere else. Take that, Case-Schilling!.

Top Reads at Heisler & Mattson Properties

Posted in Worcester, MA
April 14, 2020

Westborough, MA Home Sales and Real Estate Market Report (April 2020)

April

The Westborough Mass Homes For Sale Market Report and Statistics

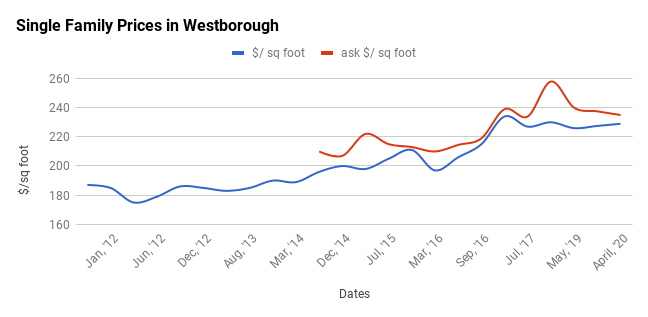
Westborough, like other towns, has seen a narrowing of the prices paid and the prices asked.  This data reflects a lot of pre-COVID numbers, so so you can see that the market was getting less optimistic even before the pandemic response. 

Can’t see the chart? You can find it Here .

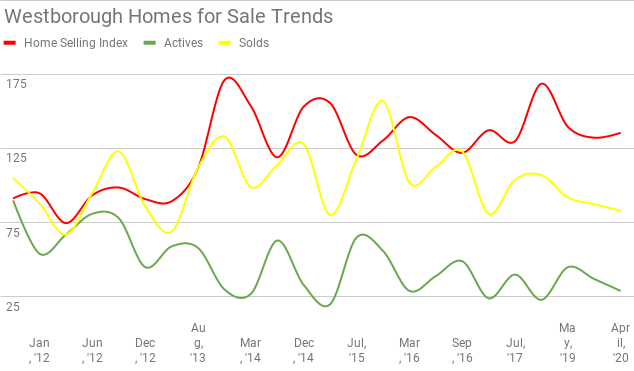
We see the HSI is still good, but not special. This is because - at the moment - the drop in inventory and the drop in transactions are cancelling each other out.  Not sure how much longer that will be the case. 

What should potential home buyers do in Westborough?

Home buyers will see reduced inventory and reduced competition. Some houses - priced right - will sit any way, as many buyers take a back seat.  I expect more aggressive buyers to be making below market offers in the coming weeks. 

Find Your Next Home or Check out the Competition!

What should future home sellers do in Westborough?

Home sellers should proceed with caution. The market strategies that used to work may not work depending on your market segment.  In particular, the luxury market looks to be slowing down considerably.  This could all be very transitory, but it's hard to know for sure right now. 

Westborough Homes For Sale and Sold Market Statistics - MLS Data

  • The Westborough “Home Seller Index” (HSI): 136 Last Report:140
  • There are 29 homes currently listed as For Sale by Home Sellers.
  • In Westboroughthere have been 83 houses sold in the last 6 months, and 48 homes sold in the last 3 months.
  • The Average number of Days on Market (DOM) was 75 days for the last 6 months of SOLD homes In Westborough.
  • Homes for sale have been looking for buyers for an average of 98 days (the homes currently for sale).
  • The amount that was paid by Home buyers in Dollars per Sq. Ft. averaged $229 (vs. $236 in the last report)
  • Current home sellers are looking for $ 235/sq foot
  • There was an Average Sold Price of $ 572,075 .
  • Westborough, MA, has 0 properties advertised as lender owned or foreclosure (typically foreclosure) .
  • There are 0 properties advertised as a short-sale is going to be needed by the lender.

All raw data are for Single Family Houses and based on data in MLS. Matt’s HSI is proprietary*, and is designed to offer town-by-town information, instead of large scale trends. *That means you won’t find it anywhere else. Take that, Case-Schilling!.

Top Reads at Heisler & Mattson Properties

Posted in Westborough, MA
April 12, 2020

Upton, MA Home Sales and Real Estate Market Report (April 2020)


April

The Upton Mass Homes For Sale Market Report and Statistics

Upton, like Sutton is another small town, and we see a price inversion in the current data.  That suggests that buyers are paying up for properties in good condition, but they are letting the homes with issues  - condition or otherwise - sit on the market until they drop to a reasonable level.  That means the market is getting rational in Upton. 

Can’t see the chart? You can find it Here .

Here in Upton we also see that the transaction trendline is heading down - depsite a big drop in interest rates.  Any surge in inventory could soften the market noticably if these trends hold. 

What should potential home buyers do in Upton?

Home buyers shouldn't chase properties with a lot of deferered maintenance or cosmetic issues. The market is fairly rational - but still rising. 

Find Your Next Home or Check out the Competition!

What should future home sellers do in Upton?

Home sellers will see the best prices in UPton to date, but they shouldn't just list their house - they should prep it for sale, and make sure that the buyers will pay max prices.  

Upton Homes For Sale and Sold Market Statistics - MLS Data

  • The Upton “Home Seller Index” (HSI): 131 Last Report: 121 
  • There are 17 homes currently listed as For Sale by Home Sellers.
  • In Upton there have been 46 houses sold in the last 6 months, and 23 homes sold in the last 3 months.
  • The Average number of Days on Market (DOM) was 37 days for the last 6 months of SOLD homes In Upton.
  • Homes for sale have been looking for buyers for an average of 86 days (the homes currently for sale).
  • The amount that was paid by Home buyers in Dollars per Sq. Ft. averaged $211 (vs.  $204 in the last report)
  • Current home sellers are looking for $ 211 /sq foot
  • There was an Average Sold Price of $ 440,348 .
  • Upton, MA, has 1 properties advertised as lender owned or foreclosure (typically foreclosure) .
  • There are 1 properties advertised as a short-sale is going to be needed by the lender.

All raw data are for Single Family Houses and based on data in MLS. Matt’s HSI is proprietary*, and is designed to offer town-by-town information, instead of large scale trends. *That means you won’t find it anywhere else. Take that, Case-Schilling!.

Top Reads at Heisler & Mattson Properties

Posted in Upton, Ma
April 11, 2020

Sutton, MA Home Sales and Real Estate Market Report (April 2020)

April

The Sutton Mass Homes For Sale Market Report and Statistics

Sutton hs also seen a narrowing of the prices between buyer and seller, and this chart shows that in somewhat dramatic fashion.  As a Worcester suburb, however, there should still be pressure on prices. 

Can’t see the chart? You can find it Here .

And here we see that inventories have continued to fall, and transactions are stable - not falling.  This market is still under pressure, but the data is probably a little skewed by the COVID reduction in inventory we've been seeing the last 2 weeks.


What should potential home buyers do in Sutton ?

Home buyers won't find much inventory - 14 houses - but that's not uncommon lately in Sutton.  It's a small town, and the inventory is always limited.  Long searches may be required for buyers, and well priced homes will see traffic and bids.

Find Your Next Home or Check out the Competition!

What should future home sellers do in Sutton ?

Prices in Sutton remain at or near the peak, so it is still a good time to sell if you;re hoping to maximize your gain. 

Sutton Homes For Sale and Sold Market Statistics - MLS Data

  • The Sutton “Home Seller Index” (HSI): 219 Last Report:158
  • There are 14 homes currently listed as For Sale by Home Sellers.
  • In Sutton there have been 68 houses sold in the last 6 months, and 27 homes sold in the last 3 months.
  • The Average number of Days on Market (DOM) was 43 days for the last 6 months of SOLD homes In Sutton.
  • Homes for sale have been looking for buyers for an average of 108 days (the homes currently for sale).
  • The amount that was paid by Home buyers in Dollars per Sq. Ft. 191 averaged (vs. 190 in the last report)
  • Current home sellers are looking for $ 190 /sq foot
  • There was an Average Sold Price of $ 408,229 .
  • Sutton , MA, has 0 properties advertised as lender owned or foreclosure (typically foreclosure) .
  • There are 0 properties advertised as a short-sale is going to be needed by the lender.

All raw data are for Single Family Houses and based on data in MLS. Matt’s HSI is proprietary*, and is designed to offer town-by-town information, instead of large scale trends. *That means you won’t find it anywhere else. Take that, Case-Schilling!.

Top Reads at Heisler & Mattson Properties

Posted in Sutton, MA
April 10, 2020

Sudbury, MA Home Sales and Real Estate Market Report (April 2020)


April

The Sudbury Mass Homes For Sale Market Report and Statistics

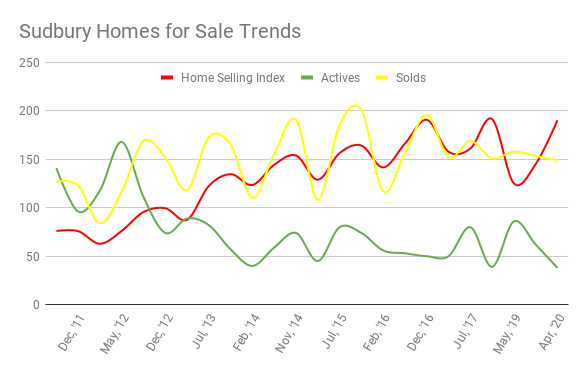
In Sudbury, we see a narrowing of the prices paid vs. the sellers ask.  That shows the market is consolidating at a price level, as the push upward moderates. 

Can’t see the chart? You can find it Here .

Here also we see the decline in activity (yellow line).  Not as pronounced as some other towns.  Inventories remain low, but the number of buyers is shrinking, as prices moderate out the buying. 

What should potential home buyers do in Sudbury?

Home buyers will find prices are still moving up and under pressure.  Desireable homes will sell fast and have good traffic.  There could be a lot fewer of them, as recently new properties have started to not list, and inventories are falling. 

Find Your Next Home or Check out the Competition!

What should future home sellers do in Sudbury?

Home sellers are looking at great prices, and should think about listing either now or after the crisis.  Of course, there could be a big bubble of listings post crisis, and that would be bad for sellers. 

Sudbury Homes For Sale and Sold Market Statistics - MLS Data

  • The Sudbury “Home Seller Index” (HSI): 190 Last Report: 145
  • There are 38 homes currently listed as For Sale by Home Sellers.
  • In Sudbury there have been 149 houses sold in the last 6 months, and 91 homes sold in the last 3 months.
  • The Average number of Days on Market (DOM) was 54 days for the last 6 months of SOLD homes In Sudbury.
  • Homes for sale have been looking for buyers for an average of 82 days (the homes currently for sale).
  • The amount that was paid by Home buyers in Dollars per Sq. Ft. averaged $268 (vs. $263 in the last report)
  • Current home sellers are looking for $ 270 /sq foot
  • There was an Average Sold Price of $ 842,313 .
  • Sudbury, MA, has 0 properties advertised as lender owned or foreclosure (typically foreclosure) .
  • There are 0 properties advertised as a short-sale is going to be needed by the lender.

All raw data are for Single Family Houses and based on data in MLS. Matt’s HSI is proprietary*, and is designed to offer town-by-town information, instead of large scale trends. *That means you won’t find it anywhere else. Take that, Case-Schilling!.

Top Reads at Heisler & Mattson Properties

Posted in Sudbury, MA
April 8, 2020

Southborough, MA Home Sales and Real Estate Market Report (April 2020)

April

The Southborough Mass Homes For Sale Market Report and Statistics

Southborough  - like Natick - has seen a drop in prices paid.  Sellers, however, remain optimistic, and are asking for buyers to come back up.

Can’t see the chart? You can find it Here .

Very similar to the other charts - low inventory, but declining transaction volume, and a drop in the HSI from it's peak.

What should potential home buyers do in Southborough?

Home buyers know that Southborough doesn't have a lot of inventory.  Choices in a certain price range can be very limited. There is still pressure on prices, and I would expect the next to move to be higher, depending on how things go with COVID. 

Search for Your Next Home or Check out the Competition!

What should future home sellers do in Southborough?

Home sellers should be careful about getting overly optimistic.  Although choices are thin, buyers have shown patience in bringing the prices down.  Some of this might be the "picked over" inventory cutting prices to sell - a typical part of the early year market - but it's hard to tell in this data. 

Southborough Homes For Sale and Sold Market Statistics - MLS Data

  • The Southborough “Home Seller Index” (HSI): 141 Last Report:121
  • There are 33 homes currently listed as For Sale by Home Sellers.
  • In Southborough there have been 64 houses sold in the last 6 months, and 29 homes sold in the last 3 months.
  • The Average number of Days on Market (DOM) was 42 days for the last 6 months of SOLD homes In Southborough.
  • Homes for sale have been looking for buyers for an average of 115 days (the homes currently for sale).
  • The amount that was paid by Home buyers in Dollars per Sq. Ft. averaged $235 (vs. $252 in the last report)
  • Current home sellers are looking for $ 266 /sq foot
  • There was an Average Sold Price of $ 725,288 .
  • Southborough, MA, has 1 properties advertised as lender owned or foreclosure (typically foreclosure) .
  • There are 0 properties advertised as a short-sale is going to be needed by the lender.

All raw data are for Single Family Houses and based on data in MLS. Matt’s HSI is proprietary*, and is designed to offer town-by-town information, instead of large scale trends. *That means you won’t find it anywhere else. Take that, Case-Schilling!.

Top Reads at Heisler & Mattson Properties

Posted in Southborough, MA
April 7, 2020

Shrewsbury, MA Home Sales and Real Estate Market Report (April 2020)

April

The Shrewsbury Mass Homes For Sale Market Report and Statistics

Shrewsbury has continued to move prices up, where many towns are treading water.

Can’t see the chart? You can find it Here .

However, signs are not all green and pointed up.  Here we also see the trendline of transactions (yellow line) trending down.  That has been a harbinger of a softening market.  There's other signs as well, mostly notably that the HSI is down hitting lower highs.  Still very good though.  

What should potential home buyers do in Shrewsbury?

Recognize the market is still competitive here.  The best homes will still be moving, but there is some evidence that COVID may be having an impact.  It's not in this data, but the COVID impacts likely won't be seen for a couple of months. 

Find Your Next Home or Check out the Competition!

What should future home sellers do in Shrewsbury?

Home sellers may still want to try this market.  With the best prices in history, you can still give it a shot.  It really depends on where you think the market will go, and I'm not making any predictions on that yet. 

Shrewsbury Homes For Sale and Sold Market Statistics - MLS Data

  • The Shrewsbury “Home Seller Index” (HSI): 187 Last Report: 124
  • There are 53 homes currently listed as For Sale by Home Sellers.
  • In Shrewsbury there have been 196 houses sold in the last 6 months, and 109  homes sold in the last 3 months.
  • The Average number of Days on Market (DOM) was 49 days for the last 6 months of SOLD homes In Shrewsbury.
  • Homes for sale have been looking for buyers for an average of 75 days (the homes currently for sale).
  • The amount that was paid by Home buyers in Dollars per Sq. Ft. averaged 232 (vs. 225  in the last report)
  • Current home sellers are looking for $ 243 /sq foot
  • There was an Average Sold Price of $ 680,832 .
  • Shrewsbury, MA, has 0 properties advertised as lender owned or foreclosure (typically foreclosure) .
  • There are 0 properties advertised as a short-sale is going to be needed by the lender.

All raw data are for Single Family Houses and based on data in MLS. Matt’s HSI is proprietary*, and is designed to offer town-by-town information, instead of large scale trends. *That means you won’t find it anywhere else. Take that, Case-Schilling!.

Top Reads at Heisler & Mattson Properties

Posted in Shrewsbury MA