General Index 

General House Hunting Articles

Things about Housing Everyone Should Know

Good Towns for Buyers, Good Towns for Sellers

Home Buying, Step by Step

Common Housing Problems and What to Do

Financing

Common Expenses when Buying or Selling Homes

After You Move In

Remodeling Slideshows for Kitchens, Baths, and others!

Newsletters

Aug. 30, 2016

Real Estate Sales for Medfield, MA - Home Sales and Real Estate Market Report (Sept, 2016)

The Medfield Homes For Sale Market Report

Medfield has been cleaned out of almost everything below 900K.  While the larger properties have been sold this year, that has moved the $/per square foot down a bit, but the average sale price has risen noticeably.  Demand has far outstripped supply, resulting in a high HSI, and very confident sellers, who are now asking record prices. 


Can’t see the chart? You can find it Here .

What should active home buyers do in Medfield ?

Not much here for bargain hunters.  A small ray of good news - many of the homes still for sale have been on for 4 months or more - and may be looking for offers - even low ones - to do a deal and sell their home.

Find Your Next Home or Check out the Competition!

What should potential home sellers do in Medfield ?

Medfield Houses For Sale and Sold Market Statistics - MLS Data

  • The Medfield “Home Seller Index” (HSI): 229 Last Report:193
  • There are 25 homes actively listed as For Sale for Home Buyers.
  • In the last 6 months, there have been 115 houses sold, and 93 homes sold in the last 3 months in Medfield.
  • The Average number of Days on Market was 42 days for recently SOLD homes.
  • There is an Average Market Time of 112 days of the Medfield homes For Sale (currently for sale).
  • The amount that was paid by Home buyers in Dollars per Square Foot averaged $266 (vs. $276 in the last report)
  • Current home sellers are looking for $ 317 /sq foot
  • There was an Average Sold Price of  $732,569 .
  • Medfield , MA, has 0 properties advertised as lender owned or foreclosure (typically foreclosure) .
  • There are 1 properties advertised as a short-sale is going to be needed by the lender.

All raw data are for Single Family Houses and based on data in MLS. Matt’s HSI is proprietary*, and is designed to offer town-by-town information, instead of large scale trends. *That means you won’t find it anywhere else. Take that, Case-Schilling!.

Don’t Go Just Yet! More Information for you…

About Matt Heisler

Matt Heisler is a real-estate professional and owner of this website. He has been selling homes in MA for buyers and sellers for over 20 years. He is an expert in foreclosure purchases, short-sale purchases, short-sale sales, buy and hold investing, fix and flip investing, and of course traditional residential home sales. He is happy to take questions as they pertain to real estate on Title V, Radon, Termites, Sump Pumps, Roofs, Foundations, Wells, Septic Systems, Cash-Flow, Staging, and a host of other housing issues. As a Vanderbilt University alumnus, he is proud to serve his local community.

*All information is posted in good faith and is assumed to be reliable, but may rely on third party information sources.

Posted in Medfield, MA
Aug. 28, 2016

Real Estate Sales for Marlborough, MA - Home Sales and Real Estate Market Report (June, 2016)


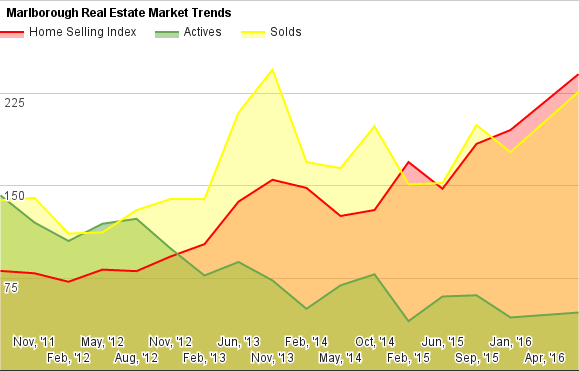
The Marlborough Homes For Sale Market Report

Can’t see the chart? You can find it Here .

What should active home buyers do in Marlborough?

Home buyers have been moving prices steadily up, as demand has exceeded supply.  Rents have continue to move, and as the economy improves, more people are seeking rent stability through housing.  Things may loosen up this spring, but sellers are moving up prices still - and are looking for new market highs.

Find Your Next Home or Check out the Competition!

What should potential home sellers do in Marlborough?

Home sellers will note that HSI is at a record for Marlborough, and things are looking good for even more price increases on the horizon.  There's still almost no inventory, and until it builds, it's hard to imagine things slowing down.

Marlborough Houses For Sale and Sold Market Statistics - MLS Data

  • The Marlborough “Home Seller Index” (HSI):240 Last Report:195
  • There are 47 homes actively listed as For Sale for Home Buyers.
  • In the last 6 months, there have been 226 houses sold, and 161 homes sold in the last 3 months in Marlborough.
  • The Average number of Days on Market was 37 days for recently SOLD homes.
  • There is an Average Market Time of 93 days of the Marlborough homes For Sale (currently for sale).
  • The amount that was paid by Home buyers in Dollars per Square Foot averaged $189 (vs. 183 in the last report)
  • Current home sellers are looking for $ 208 /sq foot
  • There was an Average Sold Price of $ $371,938 .
  • Marlborough, MA, has 0 properties advertised as lender owned or foreclosure (typically foreclosure) .
  • There are 0 properties advertised as a short-sale is going to be needed by the lender.


All raw data are for Single Family Houses and based on data in MLS. Matt’s HSI is proprietary*, and is designed to offer town-by-town information, instead of large scale trends. *That means you won’t find it anywhere else. Take that, Case-Schilling!.

Don’t Go Just Yet! More Information for you…

About Matt Heisler

Matt Heisler is a real-estate professional and owner of this website. He has been selling homes in MA for buyers and sellers for over 20 years. He is an expert in foreclosure purchases, short-sale purchases, short-sale sales, buy and hold investing, fix and flip investing, and of course traditional residential home sales. He is happy to take questions as they pertain to real estate on Title V, Radon, Termites, Sump Pumps, Roofs, Foundations, Wells, Septic Systems, Cash-Flow, Staging, and a host of other housing issues. As a Vanderbilt University alumnus, he is proud to serve his local community.

*All information is posted in good faith and is assumed to be reliable, but may rely on third party information sources.

Posted in Marlborough, MA
July 15, 2016

PokeStops in Massachusetts

Got Pokemon Fever?  While Metrowest is not exactly a hotbed of Pokemon activity, we do have some.


If you're looking for away to charge up your gameplay, I thought I'd keep track of the PokeStops that I found in the area. PokeStops, for those who are curious, are where you can pick up various game pieces that are necessary to keep playing and catch more pokemon.  I'll also create a list (or a map!) of pokemon, if they are pretty stable, and if people put them in the comments. Have some you'd like to share?  Write them in comments!


Westborough PokeStops

F3 Family Enrichment Center


Southborough PokeStops

Southborough Post Office


More to come....

July 9, 2016

The Rise of the Heat Pump in Residential Homes, A/C and Heat all in one!

What is a Heat Pump?

A heat pump is a mechanical-compression cycle refrigeration system that can heat a controlled space, or be reversed and cool the same space. Typically, there are two components to a heat pump system: an indoor unit called an air handler (which circulates air in the space) and an outdoor unit which is the heat pump, but is very similar to the compressor in standard central air installations. The refrigerant is circulated and it absorbs heat (to cool the space) or releases heat to warm the space.


What types of heat pumps are there?

There are quite a few, but the ones that I've started to see with more regularity are mini-splits (they are installed directly into the walls), and systems that are quite similar to central air installations, where the air handler is in the attic, and the heat pump which is outside.


How efficient are heat pumps? Do they save on heating costs?

Heat Pumps work with electricity and are considered very efficient. They are a recommended product by MassSave.  They are supposed to be much more efficient than traditional baseboard electric heat. The electricity doesn't come from nowhere of course, it comes from the power plant, and most power today in New England is generated from Natural Gas or Nuclear fuel (about 75%). Although electricity has gotten more expensive lately, the supply of Nat Gas is significant, and will probably keep a lid on prices for the foreseeable future. Oil has been headed in the opposite direction, but still on balance is probably more expensive than heat pumps. Certainly, heat pumps have been significantly less expensive than oil the last few years, when it traded between 3 and 4.5 dollars a gallon. Electric Heat Pumps are probably not cheaper to operate than natural gas furnaces.

Simplistically, heat pumps are a way to take advantage of the low price of Nat Gas even when you have a oil system heating your home. If oil ends up being much cheaper to operate, the old system is still installed, and can be used as the primary, so it's also a great way to "hedge" your bets on any one fuel type.


What are the real advantages of heat pumps?

As noted above, heat pumps can save you money with heating your home. But they can ALSO cool your home. So if you don't have A/C, a heat pump can be a great solution. A/C is a feature more and more buyers expect, so you can increase the value of your home and save on energy costs with these systems.


What are cautions with heat pumps?


  • Heat Pumps don't work very well when it gets really cold out. The newer systems can operate in temperatures below freezing, but you'll still need another heat source in your home for the coldest parts of winter.
  • The larger systems require duct work to be run in your house, if you don't have duct work already. This is an additional expense.


A mini-split system.  The top unit is the one that is wall

 mounted in the home.


  • There are "ductless" systems, but they need to be installed in the wall, and while generally unobtrusive, are not invisible like central air or even forced hot water (which is not invisible, it must be said, but is not at eye level either).
  • The ductless systems generally require multiple wall units to cool a home of any significant size. And although they take up minimal space inside, outside, having 3 or four compressors will take up significant space, and often doesn't look very good compared to central A/C.

Don’t Go Just Yet! More Information for you…

About Matt Heisler

Matt Heisler is a real-estate professional and owner of this website. He has been selling homes in MA for buyers and sellers for over 20 years. He is an expert in foreclosure purchases, short-sale purchases, short-sale sales, buy and hold investing, fix and flip investing, and of course traditional residential home sales. He is happy to take questions as they pertain to real estate on Title V, Radon, Termites, Sump Pumps, Roofs, Foundations, Wells, Septic Systems, Cash-Flow, Staging, and a host of other housing issues. As a Vanderbilt University alumnus, he is proud to serve his local community.

*All information is posted in good faith and is assumed to be reliable, but may rely on third party information sources.
June 25, 2016

Should I Buy A Home with Knob and Tube Wiring?

Is Knob and Tube Wiring a Reason Not to Buy a Home?


If you're looking at antique homes, you may come across Knob & Tube wiring, which is something not many of us are familiar with. An excellent Wiki is here. But as far as purchasing a home in MA, I've embedded some practical advice here. Let's look at some Myths and Facts about Knob and Tube.

Statement: Knob & Tube Wiring is dangerous.

Upgrading Knob and Tube Wiring

is a Big Job - But can be Done.

This is mostly a myth, but has some practical truth to it. Knob and Tube has many problems, two of which are that it is easy to interfere with the installation, and the components of common Knob and Tube degrade over time. Both of these issues can decrease the safety of the installation, making Knob and Tube unsafe.  An example is the cloth insulation over the wires wasn't meant to be 90 years old, and it often is at this point. Also, it's designed not to be covered in insulation or any thing else, as the wires need to be exposed to air to dissipate heat, however many home owners add insulation to their home, and when done improperly, insulation could degrade the safety of the Knob and Tube. It is true that Knob and Tube does not have a ground wire, and ground wires today are largely for safety. Lastly, most Knob and Tube installations are not designed to handle the load of todays household electrical equipment, and too much load on a wire is unsafe. Most of the reasons make Knob and Tube a poor choice for most homeowners.


Statement: Knob and Tube must be replaced in all homes today. Another myth! But it could be difficult to get affordable insurance if you wish to keep the Knob and Tube . As it is difficult to keep Knob and Tube "Safe" most insurance companies are adding to the premiums of homes that are known to have substantial Knob and Tube.

Statement: Upgrading Knob and Tube Wiring is expensive.

This one is usually true. Since you basically have to "rewire" the sections of Knob and Tube that you are replacing, this is a manually intensive job, and labor rates for electricians are not cheap. So the more you have, the more expensive the replacement will be. It will be hard to get estimates too, as the cost can be highly variable, depending on how difficult it is to get to the various outlets and circuits.

Statement: You shouldn't ever buy a home with Knob and Tube

Definitely a myth. You should be aware of the safety risks, maintenance issues and potential costs, and factor that into your decision about what you will pay. But its certainly a solvable issue, and not one that should override your decision if you've found that perfect antique. It should be on your list of things to upgrade in most cases.

Don’t Go Just Yet! More Information for you…

About Matt Heisler

Matt Heisler is a real-estate professional and owner of this website. He has been selling homes in MA for buyers and sellers for over 20 years. He is an expert in foreclosure purchases, short-sale purchases, short-sale sales, buy and hold investing, fix and flip investing, and of course traditional residential home sales. He is happy to take questions as they pertain to real estate on Title V, Radon, Termites, Sump Pumps, Roofs, Foundations, Wells, Septic Systems, Cash-Flow, Staging, and a host of other housing issues. As a Vanderbilt University alumnus, he is proud to serve his local community.

*All information is posted in good faith and is assumed to be reliable, but may rely on third party information sources.

June 25, 2016

Pre-Paid PMI: A good option for Buyers faced with Primary Mortgage Insurance

What is PMI?

PMI, or Primary Mortgage Insurance, is one of the ugly little parts about buying real estate that most people learn about only after they've applied for a loan.  Not everyone pays PMI.  When you put down a substantial down payment, 20% or more, you do not need to pay PMI.  PMI only applies when a home purchaser needs to finance more than 80% of the home.  If you have to finance 90% of the home you need to purchase PMI.


PMI's purpose is to insure the lender against default.  Since any loan where you you are borrowing more than 80% is considered risky, PMI is the standard way for the lender to protect against that extra risk.


How is PMI Usually paid?

Normally, most PMI programs are paid monthly.  It's not cheap, and those fees add up.  PMI is typically $100 or more month - $1200 a year or more, and those fees are every year until the bank determines that your equity in the property is back at the 80% threshold. PMI costs more, the more that you borrow - so the PMI on $200K is less than the PMI on $300K.


Now all that is certainly a bummer.  But it's better, generally, than not buying a home, or waiting while you save up the whole 20%.  In Massachusetts, saving up that 20% can take a long time.  So PMI has a function, both protecting the lender and allowing banks to offer products where buyers do not need to put down 20% in order to purchase a home. If there were just a way to get rid of those monthly fees....

Is There Another Way to Pay PMI?

Either Way, PMI is Expensive.

But with Planning, You Can

 Make it Cost Effective

Most times, there is another way to pay PMI.  You can Pre-pay PMI in many cases.  Now I'll tell you straight out - it's a lot - generally about 3 years of PMI payments.  But, as we'll see, using this strategy it can cost you far less than it might normally.  You can have the seller, as part of the transaction, pre pay for the PMI policy.  Let's say the policy paid in full up front is $6,000.  The seller pays the $6000 of PMI as part of the closing, so you can now roll that fee into your mortgage, at roughly $36/month in interest - far less than the $150 you would normally be paying.  But that's not all: Since it is a one time fee, even if your home is not at the 80% threshold after 3 years, there's no additional payment, saving you thousands every year after that point.


Don’t Go Just Yet! More Information for you…

About Matt Heisler

Matt Heisler is a real-estate professional and owner of this website. He has been selling homes in MA for buyers and sellers for over 20 years. He is an expert in foreclosure purchases, short-sale purchases, short-sale sales, buy and hold investing, fix and flip investing, and of course traditional residential home sales. He is happy to take questions as they pertain to real estate on Title V, Radon, Termites, Sump Pumps, Roofs, Foundations, Wells, Septic Systems, Cash-Flow, Staging, and a host of other housing issues. As a Vanderbilt University alumnus, he is proud to serve his local community.

*All information is posted in good faith and is assumed to be reliable, but may rely on third party information sources.

June 24, 2016

MA Property Taxes:Tax Rates from Most to Least

Massachusetts Tax Rates from Most to Least-2015 Preliminary Rates, 2014 and 2013 actuals


Here's a link to the list alphabetically....


Here's a link to last years version of this list.


These rates are reposted from the Mass.gov websites.  They are sorted by Residential rate.  Rural towns, without a lot of commercial development often have high tax rates.  But they also generally have low tax values (properties are cheaper), but not always!  Also, some towns have greater service levels (pick-up trash vs. collection areas, for example) and of course more money spent on teachers and schools will affect the tax rate.  Bottom line: Tax rates are important, but looking for value for your tax dollar will yield the most satisfaction.


Directly below are the 2015 preliminary rates (projected), with 2014 right next to it.  2013's rates are below that.

Town Name

Residential Tax 2015 (est)

Residential Tax 2014 (official)

Increase or Decrease

Longmeadow

23.62

23.15

2.03%

Greenfield

22.51

20.53

9.64%

Maynard

22.31

22.29

0.09%

Ashburnham

22.28

19.83

12.36%

Shutesbury

21.53

20.6

4.51%

Adams

21.37

19.95

7.12%

Bolton

20.98

21.2

-1.04%

Wilbraham

20.88

20.44

2.15%

Paxton

20.79

20.51

1.37%

Pelham

20.79

20.4

1.91%

East Longmeadow

20.72

20.47

1.22%

Fitchburg

20.68

19.83

4.29%

Amherst

20.54

20.97

-2.05%

Southbridge

20.36

19.64

3.67%

Sherborn

20.32

20.34

-0.10%

Sharon

20.3

20.55

-1.22%

Worcester

20.07

19.54

2.71%

Gardner

19.98

18.87

5.88%

Stow

19.98

19.17

4.23%

Heath

19.96

19.12

4.39%

Warwick

19.92

18.33

8.67%

Leverett

19.88

19.2

3.54%

Ashby

19.68

19.1

3.04%

Springfield

19.67

19.71

-0.20%

Ware

19.65

18.31

7.32%

Blackstone

19.48

18.83

3.45%

Dalton

19.47

18.51

5.19%

Leominster

19.44

18.89

2.91%

Holliston

19.38

19.88

-2.52%

Palmer

19.33

18.06

7.03%

Chester

19.3


Sturbridge

19.24

19.2

0.21%

Brookfield

19.15

18.7

2.41%

Townsend

19.11

19.57

-2.35%

Chesterfield

19.09

18.44

3.52%

Holbrook

19.08

18.77

1.65%

Acton

19.05

19.45

-2.06%

Holyoke

19.04

19.04

0.00%

Athol

19.03


Rockland

19.03

18.34

3.76%

Carlisle

19

18.64

1.93%

Halifax

18.99

18.67

1.71%

Hampden

18.98

18

5.44%

Lanesborough

18.98

18.52

2.48%

Wendell

18.96

19.18

-1.15%

Westminster

18.95

18.98

-0.16%

Lancaster

18.76

18.91

-0.79%

Warren

18.75

19.1

-1.83%

Chelmsford

18.7

18.98

-1.48%

Barre

18.64

16.06

16.06%

Westborough

18.59

19.29

-3.63%

Bernardston

18.58

17.48

6.29%

Westfield

18.54

18.18

1.98%

Wayland

18.39

18.33

0.33%

Peru

18.36

17.26

6.37%

West Boylston

18.34

17.66

3.85%

Lunenburg

18.32

17.99

1.83%

Granby

18.31

16.78

9.12%

Groton

18.27

17.38

5.12%

Westhampton

18.25

17.67

3.28%

Medway

18.24

18.84

-3.18%

Brockton

18.15

18.13

0.11%

Holden

18.12

17.75

2.08%

Littleton

18.1

17.41

3.96%

Randolph

18.1

18.17

-0.39%

Colrain

18.09

17.77

1.80%

Pittsfield

18.06

17.15

5.31%

Williamsburg

17.99

17.37

3.57%

Hopkinton

17.96

17.63

1.87%

Belchertown

17.89

17.72

0.96%

Charlemont

17.88

17.2

3.95%

Framingham

17.82

18.29

-2.57%

West Bridgewater

17.81

16.49

8.00%

Harvard

17.79

17.09

4.10%

East Bridgewater

17.76

17.37

2.25%

Norfolk

17.66

17.43

1.32%

Rutland

17.65

17.11

3.16%

Wales

17.61

17.41

1.15%

Sudbury

17.6

18.03

-2.38%

Milford

17.55

17.69

-0.79%

Chicopee

17.54

16.51

6.24%

Middlefield

17.44

17.42

0.11%

Boylston

17.41

17.39

0.12%

Uxbridge

17.4

17.31

0.52%

East Brookfield

17.36

17.42

-0.34%

Shirley

17.31

16.75

3.34%

Ashland

17.3

17.39

-0.52%

Princeton

17.3

17.24

0.35%

Ludlow

17.29

17.22

0.41%

Sterling

17.29

16.93

2.13%

Hudson

17.27

17.42

-0.86%

Auburn

17.26

17.29

-0.17%

Millville

17.24

17.18

0.35%

Huntington

17.22

17.05

1.00%

Leyden

17.17

16.85

1.90%

Swampscott

17.15

18.7

-8.29%

Hamilton

17.09

17.4

-1.78%

South Hadley

17.08

16.41

4.08%

Carver

17.01

17.01

0.00%

Abington

17

17.19

-1.11%

Millis

17

17.06

-0.35%

Petersham

16.99

15.93

6.65%

West Springfield

16.99

16.41

3.53%

Montague

16.96


Tyngsborough

16.96

16.78

1.07%

Plympton

16.95

16.97

-0.12%

Upton

16.95

16.95

0.00%

Kingston

16.94

16.68

1.56%

Southwick

16.94

17.06

-0.70%

Gill

16.85


Buckland

16.8

15.74

6.73%

Brimfield

16.79

16.42

2.25%

Easton

16.78

16.65

0.78%

Lynn

16.75


Dunstable

16.73

15.77

6.09%

Northborough

16.73

16.59

0.84%

North Adams

16.69

15.92

4.84%

Sutton

16.68

16.88

-1.18%

Monson

16.67

16.2

2.90%

Clinton

16.66

16.15

3.16%

Boxborough

16.65

17.69

-5.88%

Northfield

16.65

15.49

7.49%

Templeton

16.64


North Reading

16.62

16.43

1.16%

Hopedale

16.58

16.29

1.78%

Grafton

16.5

15.26

8.13%

Norwell

16.5

16.37

0.79%

New Salem

16.48

16.12

2.23%

Douglas

16.46

16.23

1.42%

Millbury

16.46

17.1

-3.74%

Topsfield

16.45

16.16

1.79%

Salem

16.41

16.73

-1.91%

Avon

16.37

15.91

2.89%

Tewksbury

16.37

16.11

1.61%

Merrimac

16.25

15.89

2.27%

Savoy

16.25

15.96

1.82%

Wenham

16.25

18.88

-13.93%

Bridgewater

16.24

16.25

-0.06%

New Braintree

16.24

16.34

-0.61%

Westford

16.24

16.6

-2.17%

Holland

16.23

15.91

2.01%

Conway

16.17


Whately

16.17

15.77

2.54%

Hanover

16.15

16.21

-0.37%

Berlin

16.09

16.67

-3.48%

Medfield

16.04

16.12

-0.50%

Georgetown

16.03

14.05

14.09%

Southborough

16.02

16.18

-0.99%

Mendon

16.01

16.02

-0.06%

Boxford

15.99

15.47

3.36%

Ashfield

15.97

16.16

-1.18%

Pepperell

15.95

15.86

0.57%

Hanson

15.92

15.47

2.91%

Hardwick

15.9

15.82

0.51%

Dedham

15.87

16.08

-1.31%

Northampton

15.8

15.39

2.66%

Middleborough

15.78

15.6

1.15%

Marlborough

15.76

16.11

-2.17%

Hawley

15.75

16.05

-1.87%

Agawam

15.74

15.55

1.22%

New Bedford

15.73

15.16

3.76%

Southampton

15.71

15.2

3.36%

Phillipston

15.7

16.29

-3.62%

Walpole

15.7

15.76

-0.38%

West Newbury

15.69

15.8

-0.70%

Whitman

15.61

15.81

-1.27%

Williamstown

15.61

15.28

2.16%

Duxbury

15.6

16.15

-3.41%

North Brookfield

15.59

15.24

2.30%

Plymouth

15.54

15.13

2.71%

Mansfield

15.5

15.77

-1.71%

Lowell

15.48

15.14

2.25%

Blandford

15.44

15.3

0.92%

Essex

15.42

15.24

1.18%

Plainville

15.42

14.96

3.07%

Norton

15.39

15.37

0.13%

Haverhill

15.35

16.09

-4.60%

Raynham

15.24

15.42

-1.17%

Westwood

15.24

15.4

-1.04%

Foxborough

15.19

14.99

1.33%

Easthampton

15.15

14.86

1.95%

Stoughton

15.13

15.74

-3.88%

Lawrence

15.12

15.61

-3.14%

Taunton

15.01

14.61

2.74%

West Brookfield

14.98

14.19

5.57%

Wrentham

14.98

15.31

-2.16%

Andover

14.97

15.18

-1.38%

Deerfield

14.94

13.71

8.97%

Dracut

14.93

14.49

3.04%

Hubbardston

14.92

14.52

2.75%

Danvers

14.91

14.85

0.40%

Lexington

14.86

15.51

-4.19%

Franklin

14.84

14.45

2.70%

Sandwich

14.82

14.57

1.72%

Dighton

14.8

15.23

-2.82%

Revere

14.8

15.55

-4.82%

Goshen

14.74

14.52

1.52%

Pembroke

14.74

14.69

0.34%

Attleboro

14.71

14.85

-0.94%

Reading

14.7

14.74

-0.27%

Webster

14.68

13.29

10.46%

Ayer

14.62

14.08

3.84%

Bedford

14.62

15.71

-6.94%

Groveland

14.61

15.06

-2.99%

Methuen

14.6

14.85

-1.68%

Quincy

14.6

14.86

-1.75%

Leicester

14.54

14.53

0.07%

Lynnfield

14.49

14.77

-1.90%

Sheffield

14.49

13.74

5.46%

North Andover

14.39

14.41

-0.14%

Montgomery

14.37

14.2

1.20%

Wilmington

14.37

14.24

0.91%

Winthrop

14.34

15.58

-7.96%


14.31


Concord

14.29

14.45

-1.11%

Acushnet

14.28

13.95

2.37%

Bellingham

14.25

14.66

-2.80%

Lakeville

14.25

14.2

0.35%

Rowley

14.24

14.74

-3.39%

Lincoln

14.15

14.41

-1.80%

Beverly

14.11

14.16

-0.35%

Clarksburg

14.09

13.36

5.46%

Lee

14.08

14.15

-0.49%

Billerica

14.04

14.29

-1.75%

Hull

13.94

13.87

0.50%

Milton

13.94

14.99

-7.00%

Worthington

13.94

14

-0.43%

Berkley

13.91

12.81

8.59%

Shelburne

13.89

13.62

1.98%

Natick

13.82

14.18

-2.54%

Middleton

13.78

13.9

-0.86%

Great Barrington

13.72

13.56

1.18%

Oakham

13.68

12.96

5.56%

Spencer

13.67

13.15

3.95%

Gloucester

13.65

12.98

5.16%

Arlington

13.55

13.79

-1.74%

Ipswich

13.51

13.43

0.60%

Wakefield

13.48

12.78

5.48%

Charlton

13.42

12.66

6.00%

Washington

13.41

13.43

-0.15%

Northbridge

13.38

13.26

0.90%

Newburyport

13.34

14.16

-5.79%

Windsor

13.31

13.16

1.14%

Marshfield

13.29

13.29

0.00%

Seekonk

13.23

13.33

-0.75%

Shrewsbury

13.2

12.17

8.46%

Hatfield

13.17

12.67

3.95%

North Attleborough

13.14

13.24

-0.76%

Swansea

13.13

12.84

2.26%

Scituate

13.1

13.05

0.38%

Fall River

13.08

12.58

3.97%

Mattapoisett

13

12.72

2.20%

Sandisfield

13

12.7

2.36%

Cummington

12.97

13.09

-0.92%

Melrose

12.96

13.28

-2.41%

Stoneham

12.96

13.49

-3.93%

Belmont

12.9

13.5

-4.44%

Freetown

12.9

12.61

2.30%

Weymouth

12.9

13.3

-3.01%

Canton

12.82

12.87

-0.39%

Cohasset

12.71

12.54

1.36%

Dover

12.7

13.08

-2.91%

Granville

12.68

12.66

0.16%

Hingham

12.53

12.56

-0.24%

Lenox

12.33

12.07

2.15%

Rehoboth

12.31

12.44

-1.05%

Peabody

12.3

12.4

-0.81%

Weston

12.28

12.73

-3.53%

Dudley

12.26

11.68

4.97%

Fairhaven

12.15

11.5

5.65%

Winchester

12.14

12.66

-4.11%

Saugus

12.02

11.61

3.53%

Cheshire

11.94

11.16

6.99%

West Stockbridge

11.84

11.12

6.47%

Hinsdale

11.82

12.77

-7.44%

Salisbury

11.75

11.79

-0.34%

Medford

11.7

12.25

-4.49%

Newton

11.61

12.12

-4.21%

Wellesley

11.56

11.54

0.17%

Newbury

11.52

11.32

1.77%

Norwood

11.47

11.58

-0.95%

Burlington

11.35

12

-5.42%

Needham

11.29

11.64

-3.01%

Marion

11.11

10.59

4.91%

Marblehead

11.08

11.09

-0.09%

Braintree

11.07

11.42

-3.06%

Wareham

11.04

10.77

2.51%

Rockport

11

11.27

-2.40%

Richmond

10.98

10.29

6.71%

Nahant

10.92

11.03

-1.00%

Hadley

10.86

10.64

2.07%

Manchester By The Sea

10.84

10.45

3.73%

Becket

10.45

10.44

0.10%

Woburn

10.17

10.44

-2.59%

Bourne

10.07

9.68

4.03%

Yarmouth

10.04

10.19

-1.47%

Dartmouth

9.81

9.86

-0.51%

New Marlborough

9.44

9.16

3.06%

Mashpee

9.11

9.2

-0.98%

Harwich

8.97

8.77

2.28%

Egremont

8.88


Stockbridge

8.67

8.76

-1.03%

Erving

8.62

8.45

2.01%

Brewster

8.26

8.18

0.98%

Falmouth

8.19

8.15

0.49%

Oak Bluffs

7.96

7.81

1.92%

Westport

7.93

7.7

2.99%

New Ashford

7.9

8.2

-3.66%

Otis

7.53

7.3

3.15%

Provincetown

7.38

7.25

1.79%

Eastham

7.1

7.02

1.14%

Tolland

6.95

7.24

-4.01%

Wellfleet

6.78

6.7

1.19%

Tyringham

6.66

6.58

1.22%

Truro

6.63

6.43

3.11%

Orleans

6.42

6.2

3.55%

Dennis

6.4

6.35

0.79%

Monterey

5.92

6.08

-2.63%

Mount Washington

5.73

5.66

1.24%

Chatham

4.99

5.08

-1.77%

Alford

4.3

4.3

0.00%

Edgartown

3.47

3.7

-6.22%

Hancock

2.84

2.84

0.00%

Amesbury

unk

20.97


Aquinnah

unk

4.69


Barnstable

unk

9.12


Boston

unk

12.58


Brookline

unk

11.39


Cambridge

unk

8.38


Chelsea

unk

14.88


Chilmark

unk

2.48


Devens (Mass Development Finance)

unk

16.96


Everett

unk

15.04


Malden

unk

16.1


Nantucket

unk

3.76


Plainfield

unk

17.88


Rochester

unk

13.85


Rowe

unk

6.07


Somerville

unk

12.66


South Shore Tri-Town

unk

13.47


Tisbury

unk

8.39


Waltham

unk

13.43


Watertown

unk

14.96


West Tisbury

unk

5.41


1.04%


Massachusetts Tax Rates from Most to Least-2013 Preliminary Rates

2013 Below

Your Real Estate Taxes are generally

Tax deductible.  But that doesn't mean

a high tax rate is good for you wallet.

Here's a link to the list alphabetically....


Here's a link to last years version of this list.


These rates are reposted from the Mass.gov websites.  They are sorted by Residential rate.  Rural towns, without a lot of commercial development often have high tax rates.  But they also generally have low tax values (properties are cheaper), but not always!  Also, some towns have greater service levels (pick-up trash vs. collection areas, for example) and of course more money spent on teachers and schools will affect the tax rate.  Bottom line: Tax rates are important, but looking for value for your tax dollar will yield the most satisfaction.

Community

Residential

Commercial

Industrial

Personal

Date Approved


Longmeadow

21.54

21.54

21.54

21.54

12/04/12


Bolton

20.96

20.96

20.96

20.96

12/04/12


Greenfield

20.72

20.72

20.72

20.72

12/12/12


Sharon

20.45

20.45

20.45

20.45

12/12/12


Amherst

20.39

20.39

20.39

20.39

12/10/12


Chester

20.28

20.28

20.28

20.28

12/11/12


Shutesbury

20.27

20.27

20.27

20.27

12/04/12


Amesbury

20.24

20.24

20.24

20.24

12/14/12


Maynard

20.05

29.55

29.55

29.55

12/19/12


Heath

20.04

20.04

20.04

20.04

12/19/12


Pelham

20.03

20.03

20.03

20.03

12/13/12


Sherborn

19.72

19.72

19.72

19.72

09/13/12


Wilbraham

19.66

19.66

19.66

19.66

11/16/12


Paxton

19.22

19.22

19.22

19.22

11/08/12


Acton

19.1

19.1

19.1

19.1

12/19/12


Lancaster

19.08

19.08

19.08

19.08

12/04/12


Fitchburg

19.05

25.26

25.26

25.26

11/27/12


Westborough

18.97

18.97

18.97

18.97

11/29/12


Ashburnham

18.85

18.85

18.85

18.85

12/13/12


Swampscott

18.84

35.02

35.02

35.02

12/14/12


Orange

18.8

18.8

18.8

18.8

12/21/12


Leverett

18.66

18.66

18.66

18.66

11/02/12


East Longmeadow

18.62

18.62

18.62

18.62

11/20/12


Holliston

18.62

18.62

18.62

18.62

12/17/12


Worcester

18.58

30.85

30.85

30.85

12/06/12


Medway

18.56

18.56

18.56

18.56

11/20/12


Wenham

18.48

18.48

18.48

18.48

12/13/12


Southbridge

18.47

18.47

18.47

18.47

12/05/12


Stow

18.37

18.37

18.37

18.37

11/14/12


Westminster

18.36

18.36

18.36

18.36

12/04/12


Holyoke

18.35

39.97

39.97

39.97

12/10/12


Townsend

18.26

18.26

18.26

18.26

12/05/12


Adams

18.25

21.67

21.67

21.67

11/14/12


Dalton

18.12

18.12

18.12

18.12

12/12/12


Holbrook

18.11

34.96

34.96

34.96

12/12/12


Lanesborough

18.07

18.07

18.07

18.07

12/11/12


Blackstone

17.99

17.99

17.99

17.99

12/12/12


Chesterfield

17.99

17.99

17.99

17.99

12/18/12


Halifax

17.99

17.99

17.99

17.99

09/13/12


Sudbury

17.99

23.52

23.52

23.52

12/17/12


Leominster

17.96

17.96

17.96

17.96

12/19/12


Chelmsford

17.95

17.95

17.95

17.95

11/27/12


Sturbridge

17.95

21.38

21.38

21.38

09/13/12


Warren

17.94

17.94

17.94

17.94

11/20/12


Wayland

17.89

17.89

17.89

17.89

12/11/12


Framingham

17.84

39.98

39.98

39.98

12/19/12


Boxborough

17.69

17.69

17.69

17.69

12/04/12


Carlisle

17.68

17.68

17.68

17.68

12/05/12


Rockland

17.58

17.58

17.58

17.58

12/19/12


Princeton

17.5

17.5

17.5

17.5

11/29/12


Ashby

17.47

17.47

17.47

17.47

11/20/12


Gardner

17.46

17.46

17.46

17.46

12/07/12


Hampden

17.45

17.45

17.45

17.45

11/29/12


West Boylston

17.45

17.45

17.45

17.45

12/06/12


Warwick

17.43

17.43

0

17.43

12/21/12


Brookfield

17.42

17.42

17.42

17.42

12/18/12


Holden

17.37

17.37

17.37

17.37

11/14/12


Randolph

17.35

30.73

30.73

30.73

12/24/12


Hopkinton

17.32

17.32

17.32

17.32

11/27/12


Lunenburg

17.3

17.3

17.3

17.3

12/21/12


Boylston

17.2

17.2

17.2

17.2

12/13/12


Hamilton

17.17

17.17

17.17

17.17

12/07/12


Ludlow

17.17

17.17

17.17

17.17

12/12/12


Westhampton

17.15

17.15

17.15

17.15

11/30/12


Ashland

17.14

17.14

17.14

17.14

12/07/12


Belchertown

17.11

17.11

17.11

17.11

12/04/12


Norfolk

17.1

17.1

17.1

17.1

12/12/12


Charlemont

17.09

17.09

17.09

17.09

12/04/12


Wales

17.07

17.07

17.07

17.07

10/26/12


Montague

17.04

25.51

25.51

25.51

11/08/12


Littleton

16.98

27.23

27.23

27.23

12/05/12


Milford

16.95

29.21

29.21

29.21

11/20/12


Ware

16.94

16.94

16.94

16.94

11/30/12


Lynn

16.93

34.55

34.55

34.55

12/17/12


Brockton

16.88

31.91

31.91

31.91

12/10/12


Bernardston

16.85

16.85

16.85

16.85

11/15/12


Groton

16.85

16.85

16.85

16.85

11/30/12


Williamsburg

16.84

16.84

16.84

16.84

12/13/12


Upton

16.72

16.72

16.72

16.72

11/27/12


Westfield

16.72

31.09

31.09

31.09

12/13/12


Auburn

16.7

23.43

23.43

23.33

11/29/12


Pittsfield

16.7

34.47

34.47

34.47

11/29/12


Palmer

16.69

16.69

16.69

16.69

12/04/12


Harvard

16.68

16.68

16.68

16.68

12/04/12


Rutland

16.66

16.66

16.66

16.66

12/11/12


Abington

16.55

16.55

16.55

16.55

12/03/12


Southborough

16.54

16.54

16.54

16.54

11/21/12


Millbury

16.48

16.48

16.48

16.48

11/14/12


Plympton

16.48

16.48

16.48

16.48

09/25/12


West Springfield

16.44

32.86

32.86

32.86

12/13/12


Kingston

16.41

16.41

16.41

16.41

12/19/12


Hudson

16.38

32.9

32.9

32.9

12/18/12


Salem

16.38

31.46

31.46

31.46

12/13/12


Huntington

16.37

16.37

16.37

16.37

12/20/12


Sterling

16.35

16.35

16.35

16.35

12/18/12


Carver

16.34

22.7

22.7

22.7

12/19/12


Colrain

16.34

16.34

16.34

16.34

09/11/12


Granby

16.34

16.34

16.34

16.34

12/18/12


Millis

16.34

16.34

16.34

16.34

12/04/12


Peru

16.3

16.3

16.3

16.3

09/18/12


Leyden

16.29

16.29

16.29

16.29

11/30/12


Uxbridge

16.28

16.28

16.28

16.28

11/29/12


Tyngsborough

16.19

16.19

16.19

16.19

12/06/12


Petersham

16.18

16.18

16.18

16.18

11/15/12


Middlefield

16.14

16.14

16.14

16.14

11/27/12


Westford

16.13

16.38

16.38

16.13

11/20/12


Northborough

16.11

16.11

16.11

16.11

12/18/12


Norwell

16.1

16.1

16.1

16.1

11/30/12


West Bridgewater

16.09

25.85

25.85

25.85

11/30/12


North Reading

16.04

16.04

16.04

16.04

11/27/12


Devens (Mass Development Finance)

16

20.21

20.21

0

12/20/12


Douglas

15.95

15.95

15.95

15.95

11/20/12


Hawley

15.95

15.95

0

15.95

12/04/12


Topsfield

15.95

15.95

15.95

15.95

12/06/12


New Braintree

15.93

15.93

15.93

15.93

12/18/12


East Bridgewater

15.9

15.9

15.9

15.9

11/27/12


Malden

15.88

25.42

25.42

25.42

11/27/12


Bridgewater

15.83

15.83

15.83

15.83

12/06/12


Easton

15.8

15.8

15.8

15.8

12/04/12


Dedham

15.79

34.37

34.37

34.37

12/10/12


Whitman

15.79

15.79

15.79

15.79

11/29/12


West Newbury

15.75

15.75

15.75

15.75

12/11/12


Chicopee

15.74

31.4

31.4

31.4

10/31/12


Medfield

15.73

15.73

15.73

15.73

12/06/12


Haverhill

15.65

26.24

26.24

26.24

12/18/12


Shirley

15.65

15.65

15.65

15.65

11/27/12


Everett

15.64

43.04

43.04

43.04

12/18/12


Holland

15.61

15.61

15.61

15.61

10/02/12


Agawam

15.6

27.79

27.79

27.79

12/06/12


Clinton

15.59

29.18

29.18

29.18

12/10/12


Sutton

15.57

15.57

15.57

15.57

11/06/12


Phillipston

15.56

15.56

15.56

15.56

12/11/12


Revere

15.56

31.56

31.56

31.56

12/18/12


Grafton

15.55

15.55

15.55

15.55

11/14/12


Hanover

15.55

16.5

16.5

16.5

11/29/12


Dunstable

15.53

15.53

15.53

15.53

12/04/12


Hopedale

15.51

24.94

24.94

24.94

11/20/12


Southwick

15.48

15.48

15.48

15.48

11/30/12


Merrimac

15.45

15.45

15.45

15.45

12/03/12


Tewksbury

15.44

25.6

25.6

25.6

12/21/12


New Salem

15.4

18.74

18.74

18.74

12/12/12


Walpole

15.4

20.08

20.08

20.08

11/29/12


Whately

15.4

15.4

15.4

15.4

12/05/12


Berlin

15.38

21.06

21.06

20.75

09/26/12


Bedford

15.37

33.8

33.8

33.8

11/29/12


Barre

15.34

15.34

15.34

15.34

12/17/12


Gill

15.34

15.34

15.34

15.34

11/27/12


North Adams

15.3

32.95

32.95

32.95

12/19/12


Mendon

15.22

15.22

15.22

15.22

11/27/12


Lexington

15.2

28.97

28.97

28.97

12/06/12


Essex

15.15

15.15

15.15

15.15

11/29/12


Monson

15.12

15.12

15.12

15.12

12/05/12


Millville

15.11

15.11

15.11

15.11

12/14/12


Ashfield

15.09

15.09

15.09

15.09

12/21/12


Lawrence

15.08

33.41

33.41

33.41

12/10/12


Stoughton

15.07

26.2

26.2

26.2

11/01/12


Wrentham

15.07

17.88

17.88

17.82

11/27/12


Somerset

15.04

30.11

30.11

29.97

12/19/12


Lowell

15.01

31.32

31.32

31.32

12/10/12


Marlborough

15

28.46

28.46

28.46

12/18/12


Reading

14.94

14.94

14.94

14.94

11/29/12


Winchendon

14.93

14.93

14.93

14.93

11/08/12


Norton

14.92

14.92

14.92

14.92

12/03/12


South Hadley

14.91

14.91

14.91

14.91

11/30/12


Winthrop

14.91

14.91

14.91

14.91

12/21/12


Mansfield

14.89

19.33

19.33

19.33

12/04/12


Middleborough

14.89

15.84

15.84

15.84

10/31/12


Westwood

14.89

27.28

27.28

27.28

10/23/12


Boxford

14.88

14.88

14.88

14.88

12/06/12


Buckland

14.88

14.88

14.88

14.88

11/15/12


Brimfield

14.84

14.84

14.84

14.84

12/27/12


Lynnfield

14.82

16.29

16.29

16.29

12/10/12


Pepperell

14.78

14.78

14.78

14.78

12/13/12


North Brookfield

14.75

14.75

14.75

14.75

11/27/12


Milton

14.7

22.54

22.54

22.54

12/03/12


Blandford

14.69

14.69

14.69

14.69

12/21/12


Watertown

14.68

27.15

27.15

27.15

11/30/12


Raynham

14.66

20.59

20.59

20.59

12/13/12


Avon

14.65

30.42

30.42

30.39

11/15/12


East Brookfield

14.55

14.55

14.55

14.55

10/03/12


Danvers

14.54

20.23

20.23

20.23

11/29/12


Foxborough

14.54

15.13

15.13

15.13

11/14/12


Andover

14.51

24.26

24.26

24.26

11/26/12


Easthampton

14.51

14.51

14.51

14.51

11/14/12


Quincy

14.5

30.61

30.61

30.61

12/07/12


Rowley

14.5

14.5

14.5

14.5

12/11/12


Groveland

14.48

14.48

14.48

14.48

12/14/12


Bellingham

14.44

17.72

17.72

17.55

12/12/12


Southampton

14.44

14.44

14.44

14.44

12/27/12


Plymouth

14.43

14.43

14.43

14.43

12/19/12


Methuen

14.4

24.12

24.12

24.12

12/18/12


Williamstown

14.37

14.37

14.37

14.37

09/25/12


Franklin

14.34

14.34

14.34

14.34

11/29/12


Natick

14.34

14.34

14.34

14.34

12/12/12


New Bedford

14.33

29.54

29.54

29.54

12/05/12


Hanson

14.32

14.32

14.32

14.32

11/21/12


Billerica

14.31

32.89

32.89

32.89

12/07/12


Northampton

14.26

14.26

14.26

14.26

12/18/12


Lincoln

14.23

18.72

18.72

18.72

10/21/12


Pembroke

14.2

14.2

14.2

14.2

12/12/12


Duxbury

14.19

14.19

14.19

14.19

12/12/12


Chelsea

14.13

34.2

34.2

34.2

12/17/12


Lee

14.09

14.09

14.09

14.09

10/26/12


Concord

14.07

14.07

14.07

14.07

11/27/12


Montgomery

14.01

14.01

14.01

14.01

12/24/12


Dighton

14

26.29

26.29

26.29

12/20/12


Hardwick

13.94

13.94

13.94

13.94

11/20/12


Attleboro

13.88

20.46

20.46

20.46

11/29/12


Dracut

13.79

13.79

13.79

13.79

11/21/12


Taunton

13.77

30.58

30.58

30.58

12/04/12


Goshen

13.74

13.74

13.74

13.74

11/08/12


North Andover

13.72

18.85

18.85

18.85

12/13/12


Sandwich

13.72

13.72

13.72

13.72

12/10/12


Conway

13.7

13.7

13.7

13.7

09/27/12


Beverly

13.64

24.86

24.86

24.86

12/19/12


Hubbardston

13.64

13.64

13.64

13.64

12/19/12


Ayer

13.63

27.99

27.99

27.99

12/10/12


Leicester

13.62

13.62

13.62

13.62

11/08/12


Arlington

13.61

13.61

13.61

13.61

12/06/12


Wilmington

13.61

32.08

32.08

32.08

11/29/12


Middleton

13.59

13.59

13.59

13.59

12/06/12


Georgetown

13.55

13.55

13.55

13.55

11/19/12


Waltham

13.49

31.77

31.77

31.77

11/29/12


Hull

13.47

13.47

0

13.47

11/14/12


Deerfield

13.44

13.44

13.44

13.44

11/09/12


Sunderland

13.43

13.43

13.43

13.43

11/27/12


Somerville

13.42

22.38

22.38

22.38

12/13/12


Worthington

13.36

13.36

13.36

13.36

12/05/12


Sheffield

13.34

13.34

13.34

13.34

11/21/12


Belmont

13.33

13.33

13.33

13.33

12/19/12


Newburyport

13.32

13.32

13.32

13.32

12/04/12


Ipswich

13.3

13.3

13.3

13.3

12/03/12


Rochester

13.28

13.28

13.28

13.28

11/05/12


South Shore Tri-Town

13.26

26.35

0

26.35

12/20/12


West Brookfield

13.22

13.22

13.22

13.22

12/04/12


Acushnet

13.17

16.84

16.84

16.84

10/31/12


Boston

13.14

31.96

31.96

31.96

12/19/12


Great Barrington

13.14

13.14

13.14

13.14

08/29/12


Stoneham

13.06

21

21

21

11/14/12


Clarksburg

13.04

13.04

13.04

13.04

12/21/12


Melrose

13.03

19.9

19.9

19.9

12/13/12


Shelburne

12.99

12.99

12.99

12.99

10/26/12


Weymouth

12.93

21.14

21.14

21.14

12/06/12


Washington

12.91

12.91

12.91

12.91

09/18/12


Dover

12.8

12.8

12.8

12.8

12/07/12


North Attleborough

12.78

12.78

12.78

12.78

12/04/12


Spencer

12.77

12.77

12.77

12.77

11/13/12


Winchester

12.77

12.01

12.01

12.01

12/10/12


Freetown

12.76

20.57

20.57

20.57

12/12/12


Seekonk

12.75

25.55

25.55

25.47

12/17/12


Scituate

12.72

12.72

12.72

12.72

11/28/12


Gloucester

12.62

13.48

13.48

13.48

11/16/12


Sandisfield

12.6

12.6

12.6

12.6

10/11/12


Windsor

12.59

12.59

12.59

12.59

09/19/12


Lakeville

12.52

12.52

12.52

12.52

12/12/12


Webster

12.47

19.26

19.26

19.26

12/10/12


Weston

12.4

12.4

12.4

12.4

12/11/12


Oakham

12.38

12.38

12.38

12.38

12/18/12


Medford

12.36

24.39

24.39

24.39

12/19/12


Northbridge

12.35

12.35

12.35

12.35

12/18/12


Cummington

12.34

12.34

12.34

12.34

10/22/12


Hingham

12.32

12.32

12.32

12.32

12/19/12


Canton

12.3

24.99

24.99

24.99

11/15/12


Charlton

12.3

12.3

12.3

12.3

11/09/12


Hatfield

12.3

12.3

12.3

12.3

11/06/12


Wakefield

12.29

24.97

24.97

24.97

11/29/12


Mattapoisett

12.28

12.28

12.28

12.28

12/13/12


Hinsdale

12.22

12.22

12.22

12.22

12/10/12


Marshfield

12.21

12.21

12.21

12.21

12/13/12


Cohasset

12.2

12.2

12.2

12.2

12/12/12


Granville

12.1

12.1

12.1

12.1

11/30/12


Swansea

12.02

23.05

23.05

23.05

12/19/12


Peabody

11.98

23.57

23.57

23.57

12/13/12


Fall River

11.93

25.43

25.43

25.43

12/13/12


Burlington

11.85

31.7

31.7

31.7

11/27/12


Rehoboth

11.75

11.75

11.75

11.75

12/13/12


Wellesley

11.7

11.7

11.7

11.7

12/12/12


Shrewsbury

11.67

11.67

11.67

11.67

12/18/12


Brookline

11.65

18.97

18.97

18.97

12/11/12


Lenox

11.58

14.33

14.33

14.33

12/07/12


Dudley

11.56

11.56

11.56

11.56

11/27/12


Salisbury

11.51

11.51

11.51

11.51

12/13/12


Newton

11.49

21.93

21.93

21.93

12/05/12


West Stockbridge

11.44

11.44

11.44

11.44

12/07/12


Newbury

11.4

11.4

11.4

11.4

12/12/12


Needham

11.3

22.18

22.18

22.18

12/17/12


Saugus

11.28

24.9

24.9

24.9

12/03/12


Rockport

11.12

11.12

11.12

11.12

10/19/12


Braintree

11.11

25.44

25.44

25.31

12/10/12


Norwood

11.04

21.17

21.17

21.17

12/12/12


Marblehead

10.85

10.85

10.85

10.85

11/27/12


Fairhaven

10.77

21.58

21.58

21.58

11/15/12


Nahant

10.74

10.74

10.74

10.74

09/19/12


Cheshire

10.62

10.62

10.62

10.62

11/15/12


Manchester By The Sea

10.51

10.51

10.51

10.51

12/03/12


Wareham

10.47

10.47

10.47

10.47

12/18/12


Hadley

10.44

10.44

10.44

10.44

11/16/12


Woburn

10.4

27.01

27.01

27.01

12/07/12


Marion

10.36

10.36

10.36

10.36

11/28/12


Richmond

9.95

9.95

9.95

9.95

12/12/12


Yarmouth

9.88

9.88

9.88

9.88

11/29/12


Becket

9.62

9.62

9.62

9.62

12/05/12


Bourne

9.45

9.45

9.45

9.45

11/19/12


Dartmouth

9.35

14.29

14.29

14.23

11/20/12


New Ashford

9.16

12.98

12.98

12.8

11/09/12


Mashpee

9.09

9.09

9.09

9.09

11/28/12


New Marlborough

8.97

8.97

8.97

8.97

12/04/12


Barnstable

8.76

7.89

7.89

7.89

12/07/12


Florida

8.74

26.06

26.06

26.06

12/04/12


Cambridge

8.66

21.5

21.5

21.5

10/03/12


Harwich

8.58

8.58

8.58

8.58

12/12/12


Tisbury

8.48

7.87

7.87

7.87

11/21/12


Stockbridge

8.32

8.32

8.32

8.32

11/08/12


Erving

8.09

13.44

13.44

13.44

12/06/12


Falmouth

8.04

8.04

8.04

8.04

11/20/12


Brewster

7.92

7.92

7.92

7.92

09/19/12


Egremont

7.89

7.89

7.89

7.89

12/12/12


Oak Bluffs

7.71

7.71

7.71

7.71

12/07/12


Tolland

6.74

6.74

6.74

6.74

12/11/12


Eastham

6.53

6.53

6.53

6.53

09/05/12


Wellfleet

6.41

6.41

6.41

6.41

09/26/12


Rowe

6.3

14.08

14.08

14.08

12/12/12


Orleans

6.1

6.1

6.1

6.1

10/22/12


Dennis

6.09

6.09

6.09

6.09

11/30/12


Truro

6.02

6.02

6.02

6.02

09/26/12


Tyringham

6

6

0

6

11/05/12


Mount Washington

5.84

5.84

5.84

5.84


Monterey

5.59

5.59

5.59

5.59

12/04/12


West Tisbury

5.26

5.26

5.26

5.26

12/13/12


Alford

4.35

4.35

4.35

4.35

09/24/12


Aquinnah

4.32

4.32

0

4.32

12/17/12


Edgartown

3.55

3.55

3.55

3.55

12/10/12


Hancock

2.84

2.84

2.84

2.84

11/27/12


Chilmark

2.29

2.29

2.29

2.29

11/07/12


June 24, 2016

Seller Pays Closings Costs: An End to the Myth of Free Money.

This post is long overdue. It's probably one of the top questions I get from both buyers and sellers, both of whom think some sort of enormous advantage (or disadvantage) is to be had with this little trickery. If you are unsure how closing costs really work, this article is for you!


What Are Closing Costs When a Home Sells?

Lets start with some basic information. What, exactly, are closing costs? Closing costs come in two types. There are the costs for closing your loan, which are typically things that don't change. They include processing fees, lender fees, points: all that stuff. They also include things that can change a lot depending on WHEN you close: pre-paid taxes, pre-paid mortgage, pre-paid insurance, and things of that nature. For the purposes of this discussion, all those items are closing costs. (To learn more about typical closing costs, check here).

How do Closing Costs Work?

Now that we know what they are, let's talk about when they happen. Closing costs happen when the home is exchanged and title is handed over. In real-estate parlance, It's done at the close. Closing costs are added to what the buyer is paying for the house, and it's all laid out on the HUD, which is the official counting of the transaction.

Who Pays Closing Costs When a Home Sells?

Keep Track of Your Money When Buying  A House!

Sellers Can Pay Closing Costs,
But Only if the Buyer Borrows the Money!

The buyer always pays closing costs. I'll say again: the buyer ALWAYS pays closing costs. So what do they REALLY mean when the SELLER agrees to pay closing costs? We shall see below, after all, closings costs are often thousands of dollars. Wouldn't all buyers want the seller to pay them?


When the Seller Pays Closing Costs in a Home Sale Purchase, what Really Happens?

When the seller pays closing costs, the money to pay those costs comes from the "Sale" of the home. So when you look at a HUD (a settlement statement for a housing transaction), the HUD shows money from the "seller's side" going over to the "buyer's side". See, that was easy, the seller just paid for your closing costs! Or did they? Let's take a look at an actual transaction to see what happened.


Typical Transaction when the Seller Pays for Closing Costs

We're going to keep this simple for this transaction. Our seller has a mortgage of $200,000, which he owes the bank, and he wants to sell his home for $300,000. He markets the home at $310,000, and he gets an offer right away (because he listed with me...) at $300,000. Good. All set. The seller will be taking a check home from the closing for $100,000, which is what he wanted.


The Buyer calls at P & S (Purchase and Sale) and decides that he would like the seller to pay for $5000 of closing costs. No problem, we re-work the paperwork so that the buyer will pay the seller $305,000 and the seller will pay the $5000 back to the buyer for the closing costs.


"Hey, wait a minute," you say. "The seller is getting the same net! They didn't pay for anything!"


That's right. Seller's aren't dumb. They can do basic math. They are happy to pay for closing costs as long as the net they expected is the same. So there's no "free money" here. So if the seller isn't out any dough, who paid for the closing costs? Answer: The buyer. Put another way, let's say the seller has two offers: One is at 300K, but he doesn't have to pay closing costs, the other is at 303K, but he has to pay 5K in closing costs, and other than that the deals are equal. Which do you think he takes? Which would you take? Well, since the second only NETs you 298K, I'm betting you'll take the extra 2K. So don't be fooled: You can't sneak closing costs past a seller, any more than someone could sneak them by you.


The Reason Why Sellers Pay Closing Costs

Now the whole reason this happens is so that the buyer can FINANCE the closing costs. The seller pays them, but really, the bank is letting you borrow "extra" to pay the bank's own closing costs. So instead of having to take $5000 out of your checking account to pay those closing costs, you can roll it into the mortgage, for about $25/month for the next 30 years. Due to the various lending laws and guidelines, there are precious few things that you can "roll" into the mortgage. But you can, generally, roll closing costs in, so most buyers would be wise to take advantage of this financial tactic. You can always pay it down later, but  when cash is tight, this is usually the way to go.  This is a good option as long as you need the cash more than you need to avoid the extra debt. Although it can be hard to remember, for the most part, when housing is going up in value, it's a leveraged investment, and the more it's leveraged in an up market, the better your return on invested capital is going to be.


Hope that clears things up!  If you're looking for more on closing costs, check here


Do Good Things Today!

Matt Heisler

Don’t Go Just Yet! More Information for you…

About Matt Heisler

Matt Heisler is a real-estate professional and owner of this website. He has been selling homes in MA for buyers and sellers for over 20 years. He is an expert in foreclosure purchases, short-sale purchases, short-sale sales, buy and hold investing, fix and flip investing, and of course traditional residential home sales. He is happy to take questions as they pertain to real estate on Title V, Radon, Termites, Sump Pumps, Roofs, Foundations, Wells, Septic Systems, Cash-Flow, Staging, and a host of other housing issues. As a Vanderbilt University alumnus, he is proud to serve his local community.

*All information is posted in good faith and is assumed to be reliable, but may rely on third party information sources.

June 24, 2016

How Do I Know If My Septic System is Failing?

Here are 6 Good Ways to know if You're septic system is on the way out.


Where Can a Septic System Fail?

A septic system is a series or group of components. The components have changed over time, but modern-day septic systems look like this.


They have a large tank, a smaller tank (called a Distribution or D-box) and a leach field. Pipes connect each part of the system. The reason I'm showing you this diagram is a failure in just one of the components could produce some of the warning signs of system failure. But that doesn't mean your whole system has failed! I've seen many Title V inspections where the just the D-Box failed and needed to be replaced, or the Tank had cracked and needed to be replaced. It's not really a pass/fail on the whole system. Sometimes, the whole system does need to be scrapped, but you should always make sure you're talking to a knowledgeable professional. With that, we'll start with 6 things that may tell you your septic system is Failing.


Your System Fails a Title V Inspection

If you have a state licensed professional out to inspect your system, and he tells you it's failing, well, that's a bad sign for your system for sure. An obvious one, but I need to get to 6 here.

The ground above your leach-field is wet

If the ground above your leach-field is soft, wet, or there are puddles, and it

HASN'T BEEN RAINING, that's a sign of failure.  Your leach-field is designed to absorb all the household water you produce, and distribute it into the soil -without saturating or flooding it. Once your leach-field loses its distribution power, the system can't function well, and you'll have ponding.

The Ground above your Septic Tank is has Puddles

In a similar way, if the water is unable to drain quickly from the tank, than the back up will occur near the tank. This could indicate a blockage or failure in one or several components, but is a clear sign of trouble.

Your lawn looks great where the tank or leach-field are

There's another word for human waste - Fertilizer! Although we don't think about it much, the waste we produce has a purpose in the ecosystem, and that results as having a fertilizing affect on our lawns. If your leach field or tank have grass that is noticeably greener and healthier than the rest of your lawn, your system could be overflowing, and delivering waste into the ground in ways it wasn't designed to.

Your Nose Can't be Wrong

Ah, the smell of septic in the morning! It'll wake you up, that's for sure. It's not pleasant, and if you're smelling it in your home, it's a good bet something is clogged and not draining properly. It could be a small problem, or a big problem, but it's not a "take care of it later" problem. Get an expert and find the cause. Septic gases are not only smelly, they can be dangerous.

Sewage backs up into your House

Again, pretty obvious here. If it's not even getting to the tank, you could have some serious issues!

Don’t Go Just Yet! More Information for you…

About Matt Heisler

Matt Heisler is a real-estate professional and owner of this website. He has been selling homes in MA for buyers and sellers for over 20 years. He is an expert in foreclosure purchases, short-sale purchases, short-sale sales, buy and hold investing, fix and flip investing, and of course traditional residential home sales. He is happy to take questions as they pertain to real estate on Title V, Radon, Termites, Sump Pumps, Roofs, Foundations, Wells, Septic Systems, Cash-Flow, Staging, and a host of other housing issues. As a Vanderbilt University alumnus, he is proud to serve his local community.

*All information is posted in good faith and is assumed to be reliable, but may rely on third party information sources.
June 24, 2016

Which is better: 2x4 or 2x6 construction?

What is the difference between 2x4 and 2x6 Construction?

When a house is being built, the most common method, in New England, is "stick" framing, which is using pre-cut machine milled wood as the main support for the house. This type of construction has two main types: 2x4 and 2x6. Two-by-Four construction is by far the most common, and is based on the ubiquitous 2x4. Two-by-Six construction is the main alternative. Builders will often tout one way or the other as the best way, and I will use this space to talk about some of the perceptions, myths, and facts about these two construction types.


Which option, 2x4 Construction or 2x6 Construction Make a Stronger House?

2x6 Construction May Allow for the Character

of a Younger Home to Model and Older one.

The answer to this question is really neither. Housing codes are designed to have a home support a certain amount of weight on a square foot basis, and the larger 2x6 framing members are typically spaced much further apart, negating any additional strength. To be sure, there are typically strong preferences and opinions in this area, but most of the experts I've discussed this with say on balance it's a wash.


Which option, 2x4 construction or 2x6 construction is better for heating bills?

There are two elements to dramatically adjusting your heating bills when construction a home. Buying the most insulation with the highest R value (insulation capabilities), and making the house "tight", or restricting the air flow between the outside and the inside. Regardless of the construction, a tight home is likely to have the far greater impact than which framing members are used. Similarly, better insulated windows may also have an outsized effect. There is a difference though. Due to the depth that 2x6 construction has in the wall cavities, you can add more insulation - and increase the R-value of the home overall. But that is dependent on the builder adding the additional insulation, which they typically do not (If you are considering building a 2x6 home, check your specifications to see what R-value they are doing in the walls, and whether it is over and above the code or not). Unfortunately, the insulation increase in 2x6 is often theoretical, and not actual. There is a school of thought that the larger 2x6 studs will conduct less heat outside than 2x4 members, both because there are fewer of them and because they are thicker, front to back. This is logical, and makes sense, but will not be nearly as important as the insulation factor in the walls and windows.


Which option, 2x4 Construction or 2x6 Construction Looks Better?

2x6 Casement Window

Note the deep feel of this window, which is

often seen with 2x6 construction.

At first, one might think, "Well it's inside the wall, so it will look the same!" and technically, that is true. But the greater depth of 2x6 construction - the deeper walls - allow a builder to add deeper window wells as part of the home building process. This allows even humble homes to possess charm, adds character, and can do a surprising amount to the feel of a home. Homes where builders have utilized this technique I believe will sell faster and for more money - because they feel richer and less utilitarian than homes built with 2x4 construction often do. Having said that, if the builder doesn't take advantage of the depth, if won't improve the interior, and the advantage is lost. Savvy house hunters will pick up 2x6 construction that has been featured in the windows and doors quickly, as it makes a noticeable and pleasing difference.


So Which One is Better?

2x6 Window shade

Note how the large blind fits inside the deep

window well, giving a rich and deep look. With 2x4

construction, there is often not enough depth for 

a large blind.

When executed properly, the look and feel of a 2x6 home will be evident, and there will be cost savings as well, so from that perspective they have the POTENTIAL to be better. But look close. If the features aren't there and you have regular old insulation, there's no real substantial difference between the two construction methods.


What are your thoughts on 2x4 or 2x6 construction? Let Me Know in the Comments!

Don’t Go Just Yet! More Information for you…

About Matt Heisler

Matt Heisler is a real-estate professional and owner of this website. He has been selling homes in MA for buyers and sellers for over 20 years. He is an expert in foreclosure purchases, short-sale purchases, short-sale sales, buy and hold investing, fix and flip investing, and of course traditional residential home sales. He is happy to take questions as they pertain to real estate on Title V, Radon, Termites, Sump Pumps, Roofs, Foundations, Wells, Septic Systems, Cash-Flow, Staging, and a host of other housing issues. As a Vanderbilt University alumnus, he is proud to serve his local community.

*All information is posted in good faith and is assumed to be reliable, but may rely on third party information sources.