General Index 

General House Hunting Articles

Things about Housing Everyone Should Know

Good Towns for Buyers, Good Towns for Sellers

Home Buying, Step by Step

Common Housing Problems and What to Do

Financing

Common Expenses when Buying or Selling Homes

After You Move In

Remodeling Slideshows for Kitchens, Baths, and others!

Newsletters

Oct. 5, 2015

TRID is here: What do Buyers and Sellers Need To Know?

What is TRID

TRID is the latest fallout from the Mortgage and banking crisis. I know much of that seems like a long time ago, and it was, but the wheels of government turn pretty slowly. TRID is an "updated" version of documents that have been used to get mortgages and transfer property for a long time, and they have "simplified" and "clarified" them. Those words are in quotes, because I'm not sure they've done either of those things, but that is what they are supposed to do.


Fundamentally, TRID is trying to prevent borrowers (generally buyers of homes) from discovering fees, costs, or conditions that they weren't aware of at the closing table. TRID does a lot more than that, as it puts a lot of conditions on lenders and some on real estate agents, but as far as buyers and sellers of houses go, this is the main outcome of TRID.


TRID could delay

your home closing, and will

be a real test for lenders

large and small


To be fair, there were problems in this area. Currently, banks are very slow in issuing "clear-to-close" orders, which allow closings to proceed. "Clear-to-Close" is the final sign off for banks, and it means they will lend money to the borrower. Oftentimes over the past two years, clear to close happens days, and sometimes hours, before closing, which has made much of the process for buyers both stressful and difficult. Sellers are affected as well, since buyers often extended their loan commitment clauses right up until closing, which meant if the closing did not happen, the seller would have been in quite a fix.


How Will TRID Fix Things?

Well, we don't know that it will actually, and there are a lot of folks - attorneys, lenders, and real estate agents - who are greatly worried that it will make things worse, before they get better. But the premise here is simple - the buyer must know all the factors of closing on their loan a minimum of 3 days (and in some instances more days) before closing. If ANYTHING changes, than the clock starts over.  Previously, if there was a mistake on the HUD, it could get corrected at closing, often within hours, and certainly within a day. Banks had to approve HUDs, generally, but the attorneys in Massachusetts were responsible for much of that quick turnaround. Now, banks are going to be responsible for the buyer end of the HUD, so a quick turnaround is much less likely. Lenders - to be safe - will probably have to issue clear-to-close at least 7 days before the closing, and the HUD (to be safe) will need to be done and approved at least 5 days before the closing. Anything less is flirting with a disrupted closing for all parties.


If this works, it will be fantastic for buyers and sellers. Sellers will know at least a week before closing that they are going to close, and buyers will know to. This is the Hope and Promise of TRID.


Unfortunately, those of us who are close to the process are not optimistic that this will work in all cases. Only a small minority of my loans - regardless of lender - have been clear-to-close this far ahead of time.  I'm not exactly sure what the banks are going to do differently where they "all of a sudden" can get this done on time.  In addition, small errors are very common, and some of these may require a delay. Lastly, it is not clear that the banks have enough people to get these loans out the door when things get busy, like in the spring housing market.


How Can Buyers and Sellers Prepare for TRID?

All buyers and sellers should become familiar with tracking their loan status. Knowing if a loan is clear-to-close is key, and sellers should have a copy of the HUD four days before closing. If you don't, you probably aren't going to close on time. That means sellers will need to make sure that final water and sewer readings, oil readings, and other commonly transferred costs are known at least 10 days before closing. Each party should review the HUD very carefully, to make sure there are no mistakes, because finding them at closing is too late- they probably can't be fixed. The whole process could be derailed for 3 business days if a fix is required.


Be clear on the consequences! If a re-disclosure is required, an entirely new 3 day window will start! And there is nothing anyone will be able to do to shorten that window, although there are other ways that things could mostly stay on schedule.


Bottom line, is until lenders and attorneys figure out where the weak points are in the process, it's going to be a bumpy ride for anyone closing on a home this fall. Hopefully this will prepare you a bit for what's coming.

Don’t Go Just Yet! More Information for you…

About Matt Heisler

Matt Heisler is a real-estate professional and owner of this website. He has been selling homes in MA for buyers and sellers for over 20 years. He is an expert in foreclosure purchases, short-sale purchases, short-sale sales, buy and hold investing, fix and flip investing, and of course traditional residential home sales. He is happy to take questions as they pertain to real estate on Title V, Radon, Termites, Sump Pumps, Roofs, Foundations, Wells, Septic Systems, Cash-Flow, Staging, and a host of other housing issues. As a Vanderbilt University alumnus, he is proud to serve his local community.

*All information is posted in good faith and is assumed to be reliable, but may rely on third party information sources.

Oct. 4, 2015

Real Estate Sales for Millis, MA - Home Sales and Real Estate Market Report (Oct, 2015)

The Millis Homes For Sale Market Report

Millis looks good for homes sellers, and home buyers haven't been too unhappy. The reason I know? 86 home transactions, in a town that averages much closer to 45, shows that everyone is in good agreement on prices.

Can’t see the chart? You can find it Here .

Those transactions have had an effect though - on home sellers! They have gotten very, very optimistic, with current ask prices 10% above recent sales. That's a big gap!

What should active home buyers do in Millis?

Home buyers should be cautious - very little is priced at market, and may look like good value against competitive homes, but really isn't. The values have almost all sold.

Find Your Next Home or Check out the Competition!


What should potential home sellers do in Millis?

Home sellers can probably do well in this market - by pricing under the actives - but above the past sales - you can look like a value, and get a premium.


Millis Houses For Sale and Sold Market Statistics - Raw MLS Data


  • Millis‘s “Home Seller Index” (HSI): 180 Last Report: 151
  • There are 26 homes listed as For Sale.

    Homes are still coming on, but buyers

    aren't chasing prices in many places.

  • There have been 86 houses sold in the last 6 months, and 50 homes sold in the last 3 months in Millis.
  • The Average number of Days on Market was 47 days for just SOLD homes.
  • There is an Average Market Time of 72 days of the Millis homes For Sale (currently for sale).
  • The amount that was paid in Dollars per Square Foot averaged 195 (vs. 193 in the last report)
  • Current sellers are looking for $227 /sq foot
  • There was an Average Sold Price of $417,880 for sold homes.
  • Millis, MA, has 2 properties advertised as lender owned or foreclosure (typically foreclosure) .
  • There are 0 properties advertised as a short-sale is going to be needed by the lender.


All raw data are for Single Family Houses and based on data in MLS. Matt’s HSI is proprietary*, and is designed to offer town-by-town information, instead of large scale trends.

*That means you won’t find it anywhere else. Take that, Case-Schilling!.

Don’t Go Just Yet! More Information for you…

About Matt Heisler

Matt Heisler is a real-estate professional and owner of this website. He has been selling homes in MA for buyers and sellers for over 20 years. He is an expert in foreclosure purchases, short-sale purchases, short-sale sales, buy and hold investing, fix and flip investing, and of course traditional residential home sales. He is happy to take questions as they pertain to real estate on Title V, Radon, Termites, Sump Pumps, Roofs, Foundations, Wells, Septic Systems, Cash-Flow, Staging, and a host of other housing issues. As a Vanderbilt University alumnus, he is proud to serve his local community.

*All information is posted in good faith and is assumed to be reliable, but may rely on third party information sources.

Posted in Millis, MA
Oct. 2, 2015

Real Estate Sales for Milford, MA - Home Sales and Real Estate Market Report (Sept, 2015)

The Milford Homes For Sale Market Report

Milford checks in and the buyer push into Milford continues, as buyers still see good value. Here's the HSI, over 200 again:

Can’t see the chart? You can find it Here .

We do see the inventory levels creeping up - but still very low. Transaction volume was very strong this season though, and that pushes the headline number. Prices continued to creep higher.

What should active home buyers do in Milford?

Home buyers will see some options in Milford, but things are still thin. The best stuff is still moving quickly, as many buyers have lost an opportunity or two, and learn fast about the speed of the market.  With prices creeping up- value gets harder to find, so some caution is warranted, as some sellers aren't afraid of continuing to push prices.

Find Your Next Home or Check out the Competition!


What should potential home sellers do in Milford?

Curiously, things have slowed down, and the home sellers in Milford have noticed, by cutting prices. This should mean that prices will pull back this fall, as the average list price is under the recent sales price on a $/sq foot basis. Clearly, there are certain homes that are not selling as well as others, showing again that homes in A condition can command premium prices, but others can not.


Milford Houses For Sale and Sold Market Statistics - Raw MLS Data


  • Milford‘s “Home Seller Index” (HSI):204 Last Report: 190
  • There are 52 homes listed as For Sale.
  • There have been 179 houses sold in the last 6 months, and 117 homes sold in the last 3 months in Milford.
  • The Average number of Days on Market was 36 days for just SOLD homes.
  • There is an Average Market Time of 54 days of the Milford homes For Sale (currently for sale).
  • The amount that was paid in Dollars per Square Foot averaged $167 (vs. $166 in the last report)
  • Current sellers are looking for $ 160 /sq foot
  • There was an Average Sold Price of $312,640 for sold homes.
  • Milford, MA, has 1 properties advertised as lender owned or foreclosure (typically foreclosure) .
  • There are 2 properties advertised as a short-sale is going to be needed by the lender.


All raw data are for Single Family Houses and based on data in MLS. Matt’s HSI is proprietary*, and is designed to offer town-by-town information, instead of large scale trends.

*That means you won’t find it anywhere else. Take that, Case-Schilling!.

Don’t Go Just Yet! More Information for you…

About Matt Heisler

Matt Heisler is a real-estate professional and owner of this website. He has been selling homes in MA for buyers and sellers for over 20 years. He is an expert in foreclosure purchases, short-sale purchases, short-sale sales, buy and hold investing, fix and flip investing, and of course traditional residential home sales. He is happy to take questions as they pertain to real estate on Title V, Radon, Termites, Sump Pumps, Roofs, Foundations, Wells, Septic Systems, Cash-Flow, Staging, and a host of other housing issues. As a Vanderbilt University alumnus, he is proud to serve his local community.

*All information is posted in good faith and is assumed to be reliable, but may rely on third party information sources.

Posted in Milford, MA
Sept. 26, 2015

Real Estate Sales for Marlborough, MA - Home Sales and Real Estate Market Report (Sept, 2015)

The Marlborough Homes For Sale Market Report

Marlborough had a torrid spring that saw prices move in the largest jump we've seen in a while. But it was short-lived. Seller did take advantage of the price movement though, so many came away happy.

Can’t see the chart? You can find it Here .

What happened? Well, the spring market was brief, but intense - and that led to a lot of competitive situations. Many homes sold right away - undermining the buyers leverage, both at offer time and at inspection. Once the market slowed down, and the buyers thinned out, buyers started to try to claw back that home price gain. The result? We now see sellers cutting prices to get back down to the buyers expectations. Most sellers have been on a while - over 111 days - while those that got the timing right averaged just 43 days. I would expect in the next report to see prices get a lot closer to $175 in the next report - and they may be even lower. Look for the HSI to fall sharply too, even though inventory of homes remains tight, well under 75 homes for sale.

What should active home buyers do in Marlborough?

Home buyers should find some good deals - but don't get too greedy!  Homes that have been aggressive on prices are selling, showing that price levels have stabilized.

Find Your Next Home or Check out the Competition!


What should potential home sellers do in Marlborough?

Home sellers should reach for prices until next spring, or they can try in certain segments that don't have any inventory.  Luxury home sellers will find the toughest sledding, even before the snow comes.  There are many motivated sellers, and they are cutting prices, so the environment is very competitive and must be watched closely by each seller.


Marlborough Houses For Sale and Sold Market Statistics - Raw MLS Data


  • Marlborough‘s “Home Seller Index” (HSI): 184 Last Report: 147
  • There are 61 homes listed as For Sale.
  • There have been 199 houses sold in the last 6 months, and 135 homes sold in the last 3 months in Marlborough.
  • The Average number of Days on Market was 44 days for just SOLD homes.
  • There is an Average Market Time of 111 days of the Marlborough homes For Sale (currently for sale).
  • The amount that was paid in Dollars per Square Foot averaged $181 (vs. $173 in the last report)
  • Current sellers are looking for $182 /sq foot
  • There was an Average Sold Price of $360,169 for sold homes.
  • Marlborough, MA, has 1 properties advertised as lender owned or foreclosure (typically foreclosure) .


There are 2 properties advertised as a short-sale is going to be needed by the lender.


All raw data are for Single Family Houses and based on data in MLS. Matt’s HSI is proprietary*, and is designed to offer town-by-town information, instead of large scale trends.

*That means you won’t find it anywhere else. Take that, Case-Schilling!.

Don’t Go Just Yet! More Information for you…

About Matt Heisler

Matt Heisler is a real-estate professional and owner of this website. He has been selling homes in MA for buyers and sellers for over 20 years. He is an expert in foreclosure purchases, short-sale purchases, short-sale sales, buy and hold investing, fix and flip investing, and of course traditional residential home sales. He is happy to take questions as they pertain to real estate on Title V, Radon, Termites, Sump Pumps, Roofs, Foundations, Wells, Septic Systems, Cash-Flow, Staging, and a host of other housing issues. As a Vanderbilt University alumnus, he is proud to serve his local community.

*All information is posted in good faith and is assumed to be reliable, but may rely on third party information sources.

Posted in Marlborough, MA
Sept. 20, 2015

Selling your home: What's included when the offer is signed, and best practices for exclusions!

What is included when I sell my house?

Just a quick reminder that I am licensed in Massachusetts, so if you've found this page from another state, your state may have different rules.


When you sell a house, what's included? This sounds like an easy question, but it's not. Let's take a look at some items that many home sellers, (and home buyers!) get tripped up on.


1) Sheds

2) Shrubs

3) Blinds

4) Curtains

Built in bookcases are included in

the home sale by default.

5) Mirrors

6) Shelves

7) Bookcases

8) Appliances

9) Artwork/pictures

10) Wall mounted TV's


OK, so which of the above are always automatically included? If you said "just the shrubs", you are right. Everything else on this list is a case-by-case basis. The way it's settled though, by default, is whether the item is "in some way permanently affixed to the home or land". What is permanently affixed? Anything that is nailed, screwed, glued, or in someway attached so that taking it off the property would do damage, it's attached. Shrubs are permanently affixed to the land, so unless they are still in a planter, they are part of what you are selling.


Sheds, too, are almost always considered permanent, but if your shed is on wheels, or if you have a storage container on the property, those are considered temporary, and are not included in the sale.


The rest of the list:

3) Blinds

If the blinds are screwed into the wall, they are part of the house. If they have brackets, and the brackets can be open and the blinds can be removed easily, then the brackets must stay and the blinds can go.

4) Curtains

As with blinds, often the curtain rod holders are the only physical attachment. As such, the curtains themselves can often be taken. If there is no way to get the curtains off without damaging the walls or the rods, they stay.

5) Mirrors

Many wall mounted mirrors are screwed in to the wall. They should stay in most cases.

6) Shelves

If the shelves are mounted to the wall with screws or nails, they stay.

7) Bookcases

Just as with shelves, how they are attached to the wall is important. Bookcases that lean against the wall and are not attached are free to be removed.

8) Appliances

Many appliances are plugged in, and as such are not required to stay. This is why appliances are almost always mentioned in listings. Microwaves are often permanently mounted and must stay if that is the case, and often refrigerators are technically included by default, if they have ice maker connections.

9) Artwork/pictures

If the artwork is mounted, it must stay. If it is on a hook, the artwork can go, but the hook must stay!! Do not remove the hooks that any pictures are mounted on. Any hooks removed will require the homeowner to patch the hole left, and repaint.

10) Wall mounted TV's

Many mounted TV's are so built into the house that they should stay, by default.


What should I do if something is in a gray area?

For all of these items, and many others, whether it is obvious or not, it is a good idea for home sellers to EXCLUDE any and all items expressly that you intend to take. You can exclude ANYTHING, including shrubs and even light fixtures, but in most cases for extreme exclusions we will strongly encourage you to buy a replacement item and install it before the house is even shown. It is much less confusing to explain, and if the buyers never saw the item, they are unlikely to desire it. If you are purchasing a property, it is good to make sure anything that is in a gray area (like any of these items) is expressly INCLUDED. Although most people get it right, Including things is your best defense that things are clear, and prevents headaches later.

Posted in Home Selling
Sept. 19, 2015

Investor Lesson: Avoid the Capital Gains Trap for Investment Property

No, the IRS didn't forget about your investment property, and the tax deductions you took

Hey! Did you know I'm not a tax attorney or investment advisor? Well, I'm not, so make sure you remember that, as this is just a layman's example of how the IRS can trip up the unwary investment property owner.


One of the great things about real estate is you can defer taxes on investment property. How does that work? Well, it's pretty simple, in concept.


The IRS assumes that your property depreciates over its life span (which we will assume to be around 25 years, to keep things simple). Let's say I own a two-family, and I paid $400,000 for it. I borrowed 80% of the money, or $320,000. When I look at the assessor record, it says:

Land: $175,000

Building: $200,000.


Yes, I know that only adds up to $375,000. But I'm going to try to make this example realistic, and assessments don't often equal home values. At any rate, we have a pretty good breakdown, for tax purposes, of what the building is worth: 200K. Now the IRS will let me depreciate that building, 1/25th each year, which is about $8,000. Note, the land doesn't depreciate. (Of course, if you own a condo, you may not own any land, so almost the full amount will be depreciable). If my building "made" $3000 in income, I can offset that income with $8000 in depreciation, and I now have a $5,000 loss on the building as whole. This loss can offset other income on my taxes, and then I will save taxes on that offset income. More simply, if I made 100K at my job, the IRS now looks at the 100K as if I only made $95,000, as I took a $5000 loss. Since I make less, I pay less in taxes (one would hope!).


Pay less in taxes? Sounds great! Is there a catch?

Of course there is! Let's say you sell the building in 10 years. Over that time frame, the building has been regularly updated and maintained, and has appreciated, on average, 3% a year. For you math wonks, that's 400,000*1.03^10, which is approximately 530,000. Nice right? You made $130,000! Well the IRS thinks you did better than that.


The depreciated value of the property, according to the IRS, is only $120,000 at time of sale. Huh? What? Easy: You deduced 8,000 in deprecation for 10 years, or $80,000. Originally, the basis was $200,000, so 200-80=120K.


When you sell the property, the IRS looks at the difference in the depreciated value (120) and the final sale price (530). That's $410,000, and they want capital gains taxes on $410,000.


But wait, you say, I only made $130,000! The taxes on $410,000 is going to really sting!


You bet! 20% of $410,000 is $82,000. That's a big check to write. Let's look at your math at time of sale.


  • Purchase Price: $400,000.
  • Sale Price: $530,000
  • Loan Payoff: $250,000 (Assuming you have paid the minimum on a 30 year loan at 5% or so.)
  • Taxes: $82,000
  • Profit after taxes: $198,000


Whew! At least we still did very well - $198,000 after taxes and after the bank has been paid. So what's the problem?


Just because your property has been appraised for a higher valuation, beware of the cash out!

In good times, there is no problem. Real estate values generally go up, and the amount you owe on a mortgage generally goes down. But lets take the same example as above, and in year number five, let's borrow some more money.


In year number 5, the bank says my property appraises at $460. I borrow against that 90%, which is an additional 100,000 or so, leaving my mortgage balance(s) at $417,000. In five years, I still owe $375,000. Now here's how I look at time of sale:


  • Purchase Price: $400,000.
  • Sale Price: $530,000
  • Loan Payoff: $375,000 (Assuming you have paid the minimum on a 30 year loan at 5% or so.)
  • Taxes: $82,000
  • Profit after taxes: $73,000


Uh-oh. Not much less left over in this scenario now. Over 1/2 of my sale gain went to the IRS.


A Declining Market can Wipe Out the Over Leveraged Property Investor

But the real risk is a declining market. If I take the above example, and prices fall, right after I borrow the money, I'm in real trouble. Let's say when I sell, the building value has fallen just 5% from when I borrowed.


  • Purchase Price: $400,000.
  • Sale Price: $437,000
  • Loan Payoff: $375,000 (Assuming you have paid the minimum on a 30 year loan at 5% or so.)
  • IRS taxable gain: $257,000
  • Taxes: $52,000
  • Profit after taxes: $10,000


See the problem? You started with 80,000 as a down payment, but after sale of the property and paying the tax man, you've only got 10,000.  Now, to be fair, you did take cash out of the property, so you're pretty much back where you started, but getting back where you started isn't so great after 10 years.  Worse, if this was a condo, or if you had managed to borrow against the property even more, you could have to pay the IRS money from your pocket at closing.  What happened?


A couple of things, the biggest of which was being overleveraged in a declining market.  This is bad!  It's one thing to borrow against your house, which you live in, and generally the appreciation is tax free, but the same tactics do NOT apply to investment property.

The other thing we're not talking about is the cash flow the investment generated over it's life span.  That was quite a lot - considering the amount of money put at risk - so it's not really as bad an investment as it looks - assuming, of course, you did have positive cash flow.


Sept. 11, 2015

Real Estate Sales for Medfield, MA - Home Sales and Real Estate Market Report (Sept, 2015)

The Medfield Homes For Sale Market Report

This is a very much a "steady as she goes" home sales report for Medfield, Ma. Home for sale are up a little, but the spring was productive.  There's no real sign that prices are going South, but probably not enough pressure to have them move up significantly.  The number of homes for sale remain under 50 though, and homes are selling quickly, showing a competitive market for buyers.

Can’t see the chart? You can find it Here .


What should active home buyers do in Medfield?

Be aware of your budget! Like many towns, Medfield has most of its inventory in the upper ranges, and the homes under 700K move very, very quickly.

Find Your Next Home or Check out the Competition!


What should potential home sellers do in Medfield?

Similarly, home sellers should be aware that if you are selling into the top end of the market, there's a lot more competition, and pricing is more important. Homes can get stale even if they are luxury homes, if they sit too long, and then you'll get less. 5% less is manageable if you you're selling a home at $350,000. At 1.35 Million, that same 5% is $27,000. Ouch. Also, recognize that luxury buyers are on-line! If you don't have the pictures and information they need, they won't come - they are busy, goal focused individuals. Check out our integrated listings!


Medfield Houses For Sale and Sold Market Statistics - Raw MLS Data


  • Medfield's “Home Seller Index” (HSI):154 Last Report:153
  • There are 48  homes listed as For Sale.
  • There have been 121  houses sold in the last 6 months, and 78 homes sold in the last 3 months in Medfield.
  • The Average number of Days on Market was 51 days for just SOLD homes.
  • There is an Average Market Time of 95 days of the Medfield homes For Sale (currently for sale).
  • The amount that was paid in Dollars per Square Foot averaged $262 (vs. $260    in the last report)
  • Current sellers are looking for $ 285   /sq foot
  • There was an Average Sold Price of $717,409 for sold homes.
  • Medfield, MA, has 1 properties advertised as lender owned or foreclosure (typically foreclosure) .
  • There are 0 properties advertised as a short-sale is going to be needed by the lender.


All raw data are for Single Family Houses and based on data in MLS. Matt’s HSI is proprietary*, and is designed to offer town-by-town information, instead of large scale trends.

*That means you won’t find it anywhere else. Take that, Case-Schilling!.

Don’t Go Just Yet! More Information for you…

About Matt Heisler

Matt Heisler is a real-estate professional and owner of this website. He has been selling homes in MA for buyers and sellers for over 20 years. He is an expert in foreclosure purchases, short-sale purchases, short-sale sales, buy and hold investing, fix and flip investing, and of course traditional residential home sales. He is happy to take questions as they pertain to real estate on Title V, Radon, Termites, Sump Pumps, Roofs, Foundations, Wells, Septic Systems, Cash-Flow, Staging, and a host of other housing issues. As a Vanderbilt University alumnus, he is proud to serve his local community.

*All information is posted in good faith and is assumed to be reliable, but may rely on third party information sources.

Posted in Medfield, MA
Sept. 10, 2015

Real Estate Sales for Hudson, MA - Home Sales and Real Estate Market Report (Sept, 2015)

The Hudson Homes For Sale Market Report

Hudson sets a record for home sale strength, and Sellers rejoice! Hudson had a terrific spring. Buyers saw value and sellers raised prices, so everybody was pretty happy.

Can’t see the chart? You can find it Here .

The red line says it all. Note also that the number of homes for sale is near the low. But there are some odd things in this report, when we look at the price data (see chart below). Home sales prices look really strong, moving up over 5% in just one report cycle, but the homes for sale are actually WAY LOWER. Why is that? Well home buyers are sending a clear signal in Hudson: We won't do lots of work. If the home needs lots of work, buyers are walking right out that door. Homes that need minimal work, however, are fetching record prices, and getting in bid wars.

What should active home buyers do in Hudson?

Are you a contractor? There's great value in Hudson, and an opportunity to build sweat equity if you find the right gem.  If you're looking to do very little work, expect a competitive home  buying environment. Don't wait to go see a new listed property - it'll be gone when you get there.

Find Your Next Home or Check out the Competition!


What should potential home sellers do in Hudson?

Home sellers should do what they can to improve the property. The less work your home needs, the better you're going to do. With a $20+ difference a square foot, a 1500 sq foot property is getting an extra 30K-50K in price for getting closer to that "move-in" condition. Serious dough!


Hudson Houses For Sale and Sold Market Statistics - Raw MLS Data


  • Hudson‘s “Home Seller Index” (HSI): 231 Last Report: 189
  • There are 28 homes listed as For Sale.
  • There have been 130 houses sold in the last 6 months, and 84 homes sold in the last 3 months in Hudson.
  • The Average number of Days on Market was 38 days for just SOLD homes.
  • There is an Average Market Time of 101 days of the Hudson homes For Sale (currently for sale).
  • The amount that was paid in Dollars per Square Foot averaged 190 (vs. $178 in the last report)
  • Current sellers are looking for $ 171 /sq foot
  • There was an Average Sold Price of $347,359 for sold homes.
  • Hudson, MA, has 0 properties advertised as lender owned or foreclosure (typically foreclosure) .
  • There are 0 properties advertised as a short-sale is going to be needed by the lender.


All raw data are for Single Family Houses and based on data in MLS. Matt’s HSI is proprietary*, and is designed to offer town-by-town information, instead of large scale trends.

*That means you won’t find it anywhere else. Take that, Case-Schilling!.

Don’t Go Just Yet! More Information for you…

About Matt Heisler

Matt Heisler is a real-estate professional and owner of this website. He has been selling homes in MA for buyers and sellers for over 20 years. He is an expert in foreclosure purchases, short-sale purchases, short-sale sales, buy and hold investing, fix and flip investing, and of course traditional residential home sales. He is happy to take questions as they pertain to real estate on Title V, Radon, Termites, Sump Pumps, Roofs, Foundations, Wells, Septic Systems, Cash-Flow, Staging, and a host of other housing issues. As a Vanderbilt University alumnus, he is proud to serve his local community.

*All information is posted in good faith and is assumed to be reliable, but may rely on third party information sources.

Posted in Hudson, MA
Sept. 1, 2015

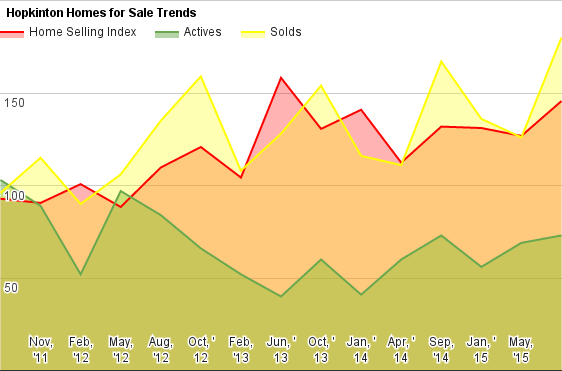
Real Estate Sales for Hopkinton, MA - Home Sales and Real Estate Market Report (Aug, 2015)

The Hopkinton Homes For Sale Market Report

In the last report, we noted that prices had been pushed to a record. Well - it didn't last - prices have pulled back some according to the most recent data. Why? Well, I think of a lot of the recent softness has to do with the large Pulte development at Legacy Farms. Although prices are really high there, much of the purchase data doesn't float through to MLS, and the extra supply is keeping a lid on prices. Are the prices at Legacy Farms worth it? That's another question for another day. Things certainly seem OK for Hopkinton sellers - but I don't see any imminent prices rises based on this data.  

Can’t see the chart? You can find it Here .


What should active home buyers do in Hopkinton?

Home buyers should make sure they understand their choices. In the 500-800 price range, there's new construction, but it's very expensive in the context of the overall market. A premium is usually paid, but that doesn't mean it can't get out of line with market fundamentals. Buyers looking at pre-owned houses will see a rational market, much cheaper than Natick, but more expensive than Ashland - as is usually the case.

Find Your Next Home or Check out the Competition!


What should potential home sellers do in Hopkinton?

Homes sellers are getting good traffic and many are getting quick sales - just not as quick as a couple of years ago. Yes, the rise in prices has slowed things down a bit, but home prices are still near their highs, and unless a lot more inventory comes on the market, prices should stay firm. Here's what you can't do - push prices up. Know your competition, or you'll have a long sales cycle.


Hopkinton Houses For Sale and Sold Market Statistics - Raw MLS Data


  • Hopkinton‘s “Home Seller Index” (HSI): 146 Last Report: 127
  • There are 73 homes listed as For Sale.
  • There have been 180 houses sold in the last 6 months, and 133 homes sold in the last 3 months in Hopkinton.
  • The Average number of Days on Market was 61 days for just SOLD homes.
  • There is an Average Market Time of 171 days of the Hopkinton homes For Sale (currently for sale).
  • The amount that was paid in Dollars per Square Foot averaged 215 (vs.222 in the last report)
  • Current sellers are looking for $226 /sq foot
  • There was an Average Sold Price of $653,684 for sold homes.
  • Hopkinton, MA, has 1 properties advertised as lender owned or foreclosure (typically foreclosure) .
  • There are 0 properties advertised as a short-sale is going to be needed by the lender.


All raw data are for Single Family Houses and based on data in MLS. Matt’s HSI is proprietary*, and is designed to offer town-by-town information, instead of large scale trends.

*That means you won’t find it anywhere else. Take that, Case-Schilling!.

Don’t Go Just Yet! More Information for you…

About Matt Heisler

Matt Heisler is a real-estate professional and owner of this website. He has been selling homes in MA for buyers and sellers for over 20 years. He is an expert in foreclosure purchases, short-sale purchases, short-sale sales, buy and hold investing, fix and flip investing, and of course traditional residential home sales. He is happy to take questions as they pertain to real estate on Title V, Radon, Termites, Sump Pumps, Roofs, Foundations, Wells, Septic Systems, Cash-Flow, Staging, and a host of other housing issues. As a Vanderbilt University alumnus, he is proud to serve his local community.

*All information is posted in good faith and is assumed to be reliable, but may rely on third party information sources.

Posted in Hopkinton MA
Aug. 31, 2015

Real Estate Sales for Holliston, MA - Home Sales and Real Estate Market Report (Aug, 2015)

The Holliston Homes For Sale Market Report

In the last report, we noted that inventories were tight, and if we didn't have more home sellers, home buyers would push prices up. That is what we saw in Holliston, but the prices weren't up much. Inventory (the number of homes for sale) is up in this report - but it's still lower than last year at this time. Prices should stay firm in Holliston, which is still a good value!

Can’t see the chart? You can find it Here .


What should active home buyers do in Holliston?

Be picky - but not too picky. There are good prices in Holliston, but things are pretty balanced, you won't be able to drive many hard bargains without taking on a fair amount of risk.

Find Your Next Home or Check out the Competition!


What should potential home sellers do in Holliston?

Prices keep climbing! If the last time you checked, you didn't like the price on your home, it's time to check again - you'll be surprised what a couple of good years can do to prices!

Home Sellers have cut prices to get closer to where the buyers are at - home buyers have raised

their bids too, though, to close the gap.


Holliston Houses For Sale and Sold Market Statistics - Raw MLS Data


  • Holliston‘s “Home Seller Index” (HSI): 163 Last Report: 150
  • There are 50 homes listed as For Sale.
  • There have been 141 houses sold in the last 6 months, and 111 homes sold in the last 3 months in Holliston.
  • The Average number of Days on Market was 56 days for just SOLD homes.
  • There is an Average Market Time of 119 days of the Holliston homes For Sale (currently for sale).
  • The amount that was paid in Dollars per Square Foot averaged $216 (vs. 211 in the last report)
  • Current sellers are looking for $ 220 /sq foot
  • There was an Average Sold Price of $525,400 for sold homes.
  • Holliston , MA, has 0 properties advertised as lender owned or foreclosure (typically foreclosure) .
  • There are 3 properties advertised as a short-sale is going to be needed by the lender.


All raw data are for Single Family Houses and based on data in MLS. Matt’s HSI is proprietary*, and is designed to offer town-by-town information, instead of large scale trends.

*That means you won’t find it anywhere else. Take that, Case-Schilling!.

Don’t Go Just Yet! More Information for you…

About Matt Heisler

Matt Heisler is a real-estate professional and owner of this website. He has been selling homes in MA for buyers and sellers for over 20 years. He is an expert in foreclosure purchases, short-sale purchases, short-sale sales, buy and hold investing, fix and flip investing, and of course traditional residential home sales. He is happy to take questions as they pertain to real estate on Title V, Radon, Termites, Sump Pumps, Roofs, Foundations, Wells, Septic Systems, Cash-Flow, Staging, and a host of other housing issues. As a Vanderbilt University alumnus, he is proud to serve his local community.

*All information is posted in good faith and is assumed to be reliable, but may rely on third party information sources.

Posted in Holliston, MA