General Index 

General House Hunting Articles

Things about Housing Everyone Should Know

Good Towns for Buyers, Good Towns for Sellers

Home Buying, Step by Step

Common Housing Problems and What to Do

Financing

Common Expenses when Buying or Selling Homes

After You Move In

Remodeling Slideshows for Kitchens, Baths, and others!

Newsletters

Nov. 5, 2014

Real Estate Sales for Shrewsbury, MA - Home Sales and Real Estate Market Report (Nov, 2014)

The Shrewsbury Homes For Sale Market Report

Shrewsbury and Northborough look quite similar, as one would expect, as they often trade buyers. Prices up modestly - but significantly. There are some differences though.

Can’t see the chart? You can find it Here .

To me, the difference is that the Shrewsbury market is a bit hotter - with an HSI at 157 - but not for long, as sellers are asking far above trading value - about 7% - meaning that things could slow down from here.


What should active home buyers do in Shrewsbury?

Be careful - the market has had a nice run here, but many houses on the market are expensive relative to the last few months sales. Try not to be time-sensitive in Shrewsbury. Or look in Northborough!

What should potential home sellers do in Shrewsbury?

Be aware that prices could stall here. Or not. But with prices at multi-year highs, many people who couldn't sell two years ago can sell today. With prices up $30/ sq foot in two years, a 1200 sq foot home has increased by $36,000! A 2000 sq foot home has increase by $60,000. You get the idea - it's a lot.


Shrewsbury Houses For Sale and Sold Market Statistics - Raw MLS Data


  • Shrewsbury‘s “Home Seller Index” (HSI): 157 Last Report: 117
  • There are 113 homes listed as For Sale.
  • There have been 222 houses sold in the last 6 months, and 133 homes sold in the last 3 months in Shrewsbury.
  • The Average number of Days on Market was 36 days for just SOLD homes.
  • There is an Average Market Time of 157 days of the Shrewsbury homes For Sale (currently for sale).
  • The amount that was paid in Dollars per Square Foot averaged $197 (vs. $192 )
  • Current sellers are looking for 214 $/sq foot
  • There was an Average Sold Price of $464,967 for sold homes.
  • Shrewsbury, MA, has 1 properties advertised as lender owned or foreclosure (typically foreclosure) .
  • There are 1 properties advertised as a short-sale is going to be needed by the lender.


*All statistics are for Single Family Houses and based on data in MLS. Matt’s HSI is proprietary, and is designed to offer town-by-town information, instead of large scale trends. (That means you won’t find it anywhere else. Take that, Case-Schilling!).

Most Googled Postings!!

About Matt Heisler

Matt Heisler is a real-estate professional and owner of this website. He has been selling homes in MA for buyers and sellers for over 20 years. He is an expert in foreclosure purchases, short-sale purchases, short-sale sales, buy and hold investing, fix and flip investing, and of course traditional residential home sales. He is happy to take questions as they pertain to real estate on Title V, Radon, Termites, Sump Pumps, Roofs, Foundations, Wells, Septic Systems, Cash-Flow, Staging, and a host of other housing issues. As a Vanderbilt University alumnus, he is proud to serve his local community.

*All information is posted in good faith and is assumed to be reliable, but may rely on third party information sources.

Posted in Shrewsbury MA
Nov. 3, 2014

Real Estate Sales for Northbridge, MA - Home Sales and Real Estate Market Report (Nov, 2014)

The Northbridge Homes For Sale Market Report

Northbridge checks in with a big surprise - a jump in prices. Let's see what happened:


Can’t see the chart? You can find it Here .

Prices jumped, but the HSI is just "OK"  - 110. What gives? That doesn't usually translate to a 5% rise in prices. Ah, but remember, there's lot of new construction in Northbridge - and lots of un-marketed inventory. But in any town with that much building, if the builders raise rates - everyone benefits. (This also happens when the builders run out of inventory as well). It looks like one or both of those things is happening, and there's a big spike in prices as a result.

What should active home buyers do in Northbridge?

Prices are probably not done moving - and won't pull back either. If the inventory is tightening up for home buyers, this could be the start of a run where prices normalize in Northbridge, and that means they'll go higher. Choose quickly, my friend.


Find Your Next Home or Check out the Competition!


What should potential home sellers do in Northbridge?

After a long stall, the ball is bouncing your way! Prices could move quickly now, and by spring you could be seeing some of the best prices in years! Time to start getting ready, if you've a mind to move. Inventory is trending downward, so price pressures are not letting up anytime soon!


Northbridge Houses For Sale and Sold Market Statistics - Raw MLS Data


  • Northbridge ‘s “Home Seller Index” (HSI): 110 Last Report: 93
  • There are 55 homes listed as For Sale.

    Home buyers have been busy in Northbridge,

    and the proof shows in home prices.

  • There have been 100 houses sold in the last 6 months, and 52 homes sold in the last 3 months in Northbridge .
  • The Average number of Days on Market was 79 days for just SOLD homes.
  • There is an Average Market Time of 159 days of the Northbridge homes For Sale (currently for sale).
  • The amount that was paid in Dollars per Square Foot averaged $164 (vs. $152)
  • Current sellers are looking for $167/sq foot
  • There was an Average Sold Price of $308,895 for sold homes.
  • Northbridge ,MA, has 0 properties advertised as lender owned or foreclosure (typically foreclosure) .
  • There are 3 properties advertised as a short-sale is going to be needed by the lender.


*All statistics are for Single Family Houses and based on data in MLS. Matt’s HSI is proprietary, and is designed to offer town-by-town information, instead of large scale trends. (That means you won’t find it anywhere else. Take that, Case-Schilling!).


Most Googled Postings!!

About Matt Heisler

Matt Heisler is a real-estate professional and owner of this website. He has been selling homes in MA for buyers and sellers for over 20 years. He is an expert in foreclosure purchases, short-sale purchases, short-sale sales, buy and hold investing, fix and flip investing, and of course traditional residential home sales. He is happy to take questions as they pertain to real estate on Title V, Radon, Termites, Sump Pumps, Roofs, Foundations, Wells, Septic Systems, Cash-Flow, Staging, and a host of other housing issues. As a Vanderbilt University alumnus, he is proud to serve his local community.

Posted in Northbridge MA
Nov. 1, 2014

Real Estate Sales for Northborough, MA - Home Sales and Real Estate Market Report (Oct, 2014)

The Northborough Homes For Sale Market Report

On to Northborough! Northborough has seen a nice move this year, as price move Northward. It's actually starting to get where it should be priced. The HSI didn't set a record, but 135 is some good stuff for home sellers - and you can tell, as prices are tops.


Can’t see the chart? You can find it Here .


What should active home buyers do in Northborough?

The average home seller in Northborough has been sitting a while. Many though, are not asking much more than current prices. That's good news for home buyers - there should be some "fairly" priced homes that with a little negotiating, can get down to attractive prices. The most popular homes, however, are gone - as the sales volume was very strong in the last six months.


Find Your Next Home or Check out the Competition!


What should potential home sellers do in Northborough?

This chart says it all: If you're thinking about moving, prices are the highest they've been in years. It's not too early to start getting your home ready for the spring market. Get a market analysis on your home, find out where the highest value items could be, and then start to get ready!


Northborough Houses For Sale and Sold Market Statistics - Raw MLS Data


  • Northborough‘s “Home Seller Index” (HSI): 135 Last Report: 114
  • There are 51 homes listed as For Sale.
  • There have been 122 houses sold in the last 6 months, and 70 homes sold in the last 3 months in Northborough.
  • The Average number of Days on Market was 65 days for just SOLD homes.
  • There is an Average Market Time of 145 days of the Northborough homes For Sale (currently for sale).
  • The amount that was paid in Dollars per Square Foot averaged $198 (vs. $194 )
  • Current sellers are looking for $202 $/sq. foot
  • There was an Average Sold Price of $436,534 for sold homes.
  • Northborough, MA, has 0 properties advertised as lender owned or foreclosure (typically foreclosure) .
  • There are 2 properties advertised as a short-sale is going to be needed by the lender.


*All statistics are for Single Family Houses and based on data in MLS. Matt’s HSI is proprietary, and is designed to offer town-by-town information, instead of large scale trends. (That means you won’t find it anywhere else. Take that, Case-Schilling!).


Most Googled Postings!!

About Matt Heisler

Matt Heisler is a real-estate professional and owner of this website. He has been selling homes in MA for buyers and sellers for over 20 years. He is an expert in foreclosure purchases, short-sale purchases, short-sale sales, buy and hold investing, fix and flip investing, and of course traditional residential home sales. He is happy to take questions as they pertain to real estate on Title V, Radon, Termites, Sump Pumps, Roofs, Foundations, Wells, Septic Systems, Cash-Flow, Staging, and a host of other housing issues. As a Vanderbilt University alumnus, he is proud to serve his local community.

*All information is posted in good faith and is assumed to be reliable, but may rely on third party information sources.

Posted in Northborough, MA
Oct. 21, 2014

Real Estate Sales for Natick, MA - Home Sales and Real Estate Market Report (Oct, 2014)

The Natick Homes For Sale Market Report

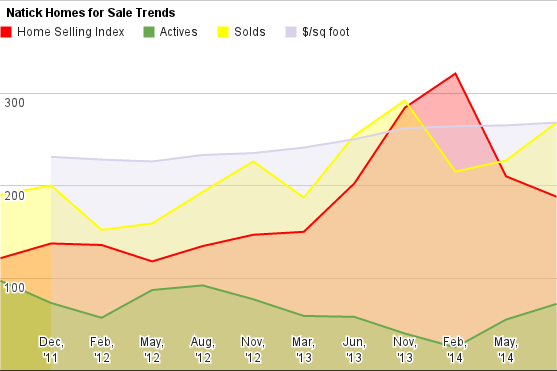
The bellweather report is here! Natick is here! What for say you, Natick!

Can’t see the chart? You can find it Here .

What is that? An HSI below 200? Oh, no, the sky is falling in Natick!! The sky is falling! Or is it? Let's see.


Hmmm. Well, overall, the report is still really good. An HSI of 188 is nothing to sneeze at. Sales are over 3x actives, but the actives have come up. We've seen this in other towns, but small changes in the actives can make big changes in the HSI, as the ratios become more normalized. So What is happening? It was a good summer right?


Yes, it was, but with prices at $268/sq foot, I think a lot of buyers are starting to "give up" on Natick - and are looking further West. That explains the rising demand in Framingham and Holliston, for example, and I think Ashland's report was very good too. But overall, we are seeing demand lessen, or more importantly, more sellers are hitting the market. Either way, the supply demand curve is getting back to normal.


What should active home buyers do in Natick?

I'm going to take Natick off my "don't shop here" list. The prices are still really high, but at least they will be getting more rational, and competitive bids won't be over properties with location and condition issues. There will still be homes that sell in competitive bid situations, but you won't be competing against 5 and 6 bidders very often.


What should potential home sellers do in Natick?

Be more cautious! Make sure you home is ready. Buyers are making decisions quickly, so if you aren't priced right, you may hang around for a bit. Home sellers need to do more thinking, because putting a sign on your lawn is no longer good enough. The market is still covering many mistakes, but it may not much longer.


Natick Houses For Sale and Sold Market Statistics - Raw MLS Data


  • Natick‘s “Home Seller Index” (HSI): 188 Last Report: 210
  • There are 72 homes listed as For Sale.

    OK, the sky isn't falling in Natick - Home prices aren't

    either.  But it's no longer the crazy town

    we've come to expect.

  • There have been 268 houses sold in the last 6 months, and 152 homes sold in the last 3 months in Natick.
  • The Average number of Days on Market was 49 days for just SOLD homes.
  • There is an Average Market Time of 81 days of the Natick homes For Sale (currently for sale).
  • The amount that was paid in Dollars per Square Foot averaged $268 (vs. $265 )
  • Current sellers are looking for $275 /sq. foot
  • There was an Average Sold Price of $578,005 for sold homes.
  • Natick, MA, has 0 properties advertised as lender owned or foreclosure (typically foreclosure) .
  • There are 0 properties advertised as a short-sale is going to be needed by the lender.


*All statistics are for Single Family Houses and based on data in MLS. Matt’s HSI is proprietary, and is designed to offer town-by-town information, instead of large scale trends. (That means you won’t find it anywhere else. Take that, Case-Schilling!).


Most Googled Postings!!

About Matt Heisler

Matt Heisler is a real-estate professional and owner of this website. He has been selling homes in MA for buyers and sellers for over 20 years. He is an expert in foreclosure purchases, short-sale purchases, short-sale sales, buy and hold investing, fix and flip investing, and of course traditional residential home sales. He is happy to take questions as they pertain to real estate on Title V, Radon, Termites, Sump Pumps, Roofs, Foundations, Wells, Septic Systems, Cash-Flow, Staging, and a host of other housing issues. As a Vanderbilt University alumnus, he is proud to serve his local community.

*All information is posted in good faith and is assumed to be reliable, but may rely on third party information sources.

Posted in Natick, MA
Oct. 20, 2014

Real Estate Sales for Milford, MA - Home Sales and Real Estate Market Report (Oct, 2014)

The Milford Homes For Sale Market Report

Milford, like Millis, is showing us the classic signs we've come to expect.


Can’t see the chart? You can find it Here .

We have rising prices - slowly, but up - slightly more inventory, good transaction volume over the last 6 months, and solid HSI. A normal, functioning, upward trending market. There are a couple of things to note. Sellers remain very bullish on home prices - asking almost 3% above current sales rates. Also, I noted a big jump in bank impacted inventory - 7 homes - or about 10% of the market. Probably just a blip, because with sales volume this aggressive, those should move quickly.

What should active home buyers do in Milford ?

Active home buyers should shop carefully, deliberately, and understand the more complex Milford market. Pricing is less simple here, and with homes moving quickly - and sellers asking high prices - knowing the intrinsic value is important.


Find Your Next Home or Check out the Competition!


What should potential home sellers do in Milford?

Home sellers should be encourage that prices are up. Re-financing is easier, and selling is easier too. Hold on has helped you - prices are up 23% off their lows - and yet surrounding towns make Milford a quality bargain, keeping demand firm.


Milford Houses For Sale and Sold Market Statistics - Raw MLS Data


  • Milford‘s “Home Seller Index” (HSI): Last Report:
  • There are 64 homes listed as For Sale.

    Get those rakes out!  Home buyers are still looking

    in Milford.

  • There have been 160 houses sold in the last 6 months, and 97 homes sold in the last 3 months in Milford.
  • The Average number of Days on Market was 77 days for just SOLD homes.
  • There is an Average Market Time of 77 days of the Milford homes For Sale (currently for sale).
  • The amount that was paid in Dollars per Square Foot averaged $163 (vs. $159 )
  • Current sellers are looking for $170/sq foot
  • There was an Average Sold Price of $281,357 for sold homes.
  • Milford, MA, has 3 properties advertised as lender owned or foreclosure (typically foreclosure) .
  • There are 4 properties advertised as a short-sale is going to be needed by the lender.


*All statistics are for Single Family Houses and based on data in MLS. Matt’s HSI is proprietary, and is designed to offer town-by-town information, instead of large scale trends. (That means you won’t find it anywhere else. Take that, Case-Schilling!).


Most Googled Postings!!

About Matt Heisler

Matt Heisler is a real-estate professional and owner of this website. He has been selling homes in MA for buyers and sellers for over 20 years. He is an expert in foreclosure purchases, short-sale purchases, short-sale sales, buy and hold investing, fix and flip investing, and of course traditional residential home sales. He is happy to take questions as they pertain to real estate on Title V, Radon, Termites, Sump Pumps, Roofs, Foundations, Wells, Septic Systems, Cash-Flow, Staging, and a host of other housing issues. As a Vanderbilt University alumnus, he is proud to serve his local community.

*All information is posted in good faith and is assumed to be reliable, but may rely on third party information sources.
Posted in Milford, MA
Oct. 17, 2014

Real Estate Sales for Millis, MA - Home Sales and Real Estate Market Report (Oct, 2014)

The Millis Homes For Sale Market Report

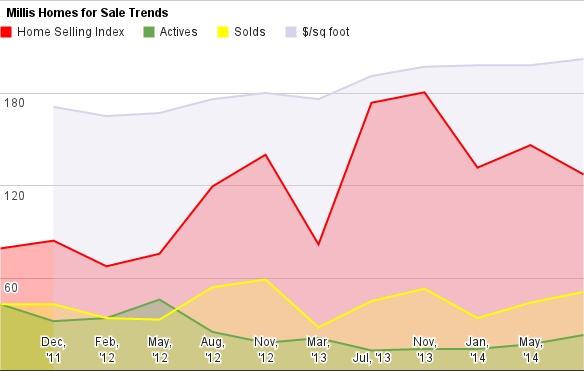
Millis checks in with a pretty standard report. Inventory levels increasing slightly, but the sellers still remain in charge. Prices are up - but only slightly over last year.

Can’t see the chart? You can find it Here .


What should active home buyers do in Millis?

With limited inventory, buyers should always consider another town where possible. Millis isn't easy to shop in right now, but it's not especially hard. The good stuff moves quickly, but there are quality options for those who can't be there at the first open house. Buyers should still be looking at many properties to make sure it's the right price, as some homes will be selling above fair market.


Find Your Next Home or Check out the Competition!


What should potential home sellers do in Millis?

With prices at their high since we've been tracking, it's a good time to sell. Demand isn't as sharp as last year, but there are still motivated buyers. This falls rate change - downward- may create some buying pressure.


Millis Houses For Sale and Sold Market Statistics - Raw MLS Data


  • Millis‘s “Home Seller Index” (HSI): 127 Last Report: 146
  • There are 23 homes listed as For Sale.

    Millis is looking very scenic this time of year,

    as home buyers keep the pressure on home prices.

  • There have been 51 houses sold in the last 6 months, and 27 homes sold in the last 3 months in Millis.
  • The Average number of Days on Market was 73 days for just SOLD homes.
  • There is an Average Market Time of 95 days of the Millis homes For Sale (currently for sale).
  • The amount that was paid in Dollars per Square Foot averaged $202 (vs. $198 )
  • Current sellers are looking for 188 $/sq foot
  • There was an Average Sold Price of $413,162 for sold homes.
  • Millis, MA, has 0 properties advertised as lender owned or foreclosure (typically foreclosure) .
  • There are 1 properties advertised as a short-sale is going to be needed by the lender.


*All statistics are for Single Family Houses and based on data in MLS. Matt’s HSI is proprietary, and is designed to offer town-by-town information, instead of large scale trends. (That means you won’t find it anywhere else. Take that, Case-Schilling!).


Most Googled Postings!!

About Matt Heisler

Matt Heisler is a real-estate professional and owner of this website. He has been selling homes in MA for buyers and sellers for over 20 years. He is an expert in foreclosure purchases, short-sale purchases, short-sale sales, buy and hold investing, fix and flip investing, and of course traditional residential home sales. He is happy to take questions as they pertain to real estate on Title V, Radon, Termites, Sump Pumps, Roofs, Foundations, Wells, Septic Systems, Cash-Flow, Staging, and a host of other housing issues. As a Vanderbilt University alumnus, he is proud to serve his local community.

*All information is posted in good faith and is assumed to be reliable, but may rely on third party information sources.

Posted in Millis, MA
Oct. 7, 2014

Real Estate Sales for Marlborough, MA - Home Sales and Real Estate Market Report (Oct, 2014)

The Marlborough Homes For Sale Market Report

Marlborough continues to improve. I thought one data point worth mentioning is the is the first report where there were no foreclosures for sale in all of Marlborough. In November of 2012 (not so long ago), there were 19 foreclosures and short sales. Yikes! But improving prices have made that less of a problem.

Can’t see the chart? You can find it Here .


What should active home buyers do in Marlborough ?

There doesn't appear to be a lot of softening in the market, which we would expect to see this time of year. Prices look to be headed higher by next Spring. Marlborough has homes at deep discounts to surrounding towns, and they are finding buyers.

Find Your Next Home or Check out the Competition!


What should potential home sellers do in Marlborough?

With prices at their highest point in years, home sellers thinking about relocating may want to start getting ready. Get some opinions on what you can do to improve the marketable price, and put a plan in place to get on the market. Home Buyers are moving pretty quickly, and paying good prices. Prices may continue to rise - or not - so if you like the price you can get, start the process.


Marlborough Houses For Sale and Sold Market Statistics - Raw MLS Data


  • Marlborough ‘s “Home Seller Index” (HSI): 130 Last Report: 125
  • There are 78 homes listed as For Sale.

    Fall is here, but buyers are still home buying in Marlborough

  • There have been 198 houses sold in the last 6 months, and 120 homes sold in the last 3 months in Marlborough.
  • The Average number of Days on Market was 92 days for just SOLD homes.
  • There is an Average Market Time of 140 days of the Marlborough homes For Sale (currently for sale).
  • The amount that was paid in Dollars per Square Foot averaged $172 (vs. $167 )
  • Current sellers are looking for $181/sq foot
  • There was an Average Sold Price of $331,171 for sold homes.
  • Marlborough ,MA, has 0 properties advertised as lender owned or foreclosure (typically foreclosure) .
  • There are 2 properties advertised as a short-sale is going to be needed by the lender.


*All statistics are for Single Family Houses and based on data in MLS. Matt’s HSI is proprietary, and is designed to offer town-by-town information, instead of large scale trends. (That means you won’t find it anywhere else. Take that, Case-Schilling!).


Most Googled Postings!!

About Matt Heisler

Matt Heisler is a real-estate professional and owner of this website. He has been selling homes in MA for buyers and sellers for over 20 years. He is an expert in foreclosure purchases, short-sale purchases, short-sale sales, buy and hold investing, fix and flip investing, and of course traditional residential home sales. He is happy to take questions as they pertain to real estate on Title V, Radon, Termites, Sump Pumps, Roofs, Foundations, Wells, Septic Systems, Cash-Flow, Staging, and a host of other housing issues. As a Vanderbilt University alumnus, he is proud to serve his local community.

*All information is posted in good faith and is assumed to be reliable, but may rely on third party information sources.

Posted in Marlborough, MA
Oct. 5, 2014

Real Estate Sales for Medfield, MA - Home Sales and Real Estate Market Report (Oct, 2014)

The Medfield Homes For Sale Market Report

Medfield has had a good spring, with prices reaching new highs here on the blog. Let's take a look at chart, and a deeper dive into the data.

Can’t see the chart? You can find it Here .

First note is that the Medfield HSI has eeked out it's best number, at 129. But I don't think it will last, as the number of homes for sale in Medfield is starting to creep up. This is a trend we're seeing in almost every report, showing that the supply/demand imbalance is being sorted out by the rise in prices.

Find Your Next Home or Check out the Competition!

We will probably be seeing more HSI under 150 across the board, as the super-heated towns return to earth.


What should active home buyers do in Medfield?

Home buyers should be a little wary. The prices have jumped quite a it, and what's left is no value. Buyers under 600 are going to have an extremely tough slog, as that part of the market is going to be full of fairly desperate buyers. If you can get above 850, things smooth out a bit.  If you look at the chart below, Medfield has often had prices pull back in the winter, so there could be some opportunities this winter. (Note the low are between march and may, which look back six months of sales. (Nov-April).


What should potential home sellers do in Medfield ?

With prices at their highs in years, it's a good time to be out there. There's still competition, but with an average time on market of just 80 days, sellers aren't waiting very long to find out if their price is right - many homes are gone in 10 days or less.


Medfield Houses For Sale and Sold Market Statistics - Raw MLS Data


  • Medfield‘s “Home Seller Index” (HSI): 129 Last Report: 137
  • There are 49 homes listed as For Sale.
  • There have been 113 houses sold in the last 6 months, and 65 homes sold in the last 3 months in Medfield.
  • The Average number of Days on Market was 80 days for just SOLD homes.
  • There is an Average Market Time of 97 days of the Medfield For Sale (currently for sale).
  • The amount that was paid in Dollars per Square Foot averaged $261 (vs. $240 )
  • Current sellers are looking for $275/sq foot
  • There was an Average Sold Price of $713,505 for sold homes.
  • Medfield, MA, has 1 properties advertised as lender owned or foreclosure (typically foreclosure) .
  • There are 0 properties advertised as a short-sale is going to be needed by the lender.


*All statistics are for Single Family Houses and based on data in MLS. Matt’s HSI is proprietary, and is designed to offer town-by-town information, instead of large scale trends. (That means you won’t find it anywhere else. Take that, Case-Schilling!).


Most Googled Postings!!

About Matt Heisler

Matt Heisler is a real-estate professional and owner of this website. He has been selling homes in MA for buyers and sellers for over 20 years. He is an expert in foreclosure purchases, short-sale purchases, short-sale sales, buy and hold investing, fix and flip investing, and of course traditional residential home sales. He is happy to take questions as they pertain to real estate on Title V, Radon, Termites, Sump Pumps, Roofs, Foundations, Wells, Septic Systems, Cash-Flow, Staging, and a host of other housing issues. As a Vanderbilt University alumnus, he is proud to serve his local community.

*All information is posted in good faith and is assumed to be reliable, but may rely on third party information sources.

Posted in Medfield, MA
Sept. 28, 2014

What do I Need to Know as A New Landlord? 10 Tips for Property Management Success

First Time Landlords: Key Steps

OK, let's get the disclaimers out of the way.

1) I'm not an attorney, and this should be construed as helpful, but not legal, advice.

2) It's targeted at Landlords in Massachusetts. Laws in other states may differ significantly.


OK. So here we go:

Vacancy Is the Enemy

Market your property slightly below market and get it rented fast. Better to have less than maximum income than no income at all. Raise the rent to market rates when the lease is up.


How do I find GREAT tenants

Every new landlord has very high tenant expectations. I'm only going to take great credit! No smokers! No pets! Not to burst your bubble, but most of those folks don't rent. They own. So let's bring down the expectation level a bit. The key is to find someone who will A) Pay you B) Take good care of your property. Those two are hard enough. Here are some tips.

1) Income is more important than credit. Always look at the credit score, but go deeper. Find out why the credit may have non-payment history. Sometimes, it's a recent divorce, or job loss, but now your tenant is on the mend, and will resume their previous good payment history. A score doesn't define a tenants life - so

Each New Tenant is A Risk:

Work Hard to Minimize It

look deeper, and ask questions. Always call the main office of the employer and ask to speak to the employee. If you get voicemail - or the applicant - odds are, they work there. That's a good start. W-2 (if possible) and bank statements (if necessary) should show regular deposits - paychecks - which he'll need to pay you.

2) Double check everything with the self-employed. It's very hard to validate income of the self-employed. But you must.

3) Be wary of anyone offering to pay you several months in advance. People with regular income streams don't need to do this.

4) Learn what you can about them - and call past landlords where possible. Find out why they are moving, and ask the old landlord if they were tough on the house.


No matter how much you scrutinize, there are no guarantees with tenants. If you can't handle that uncertainty, you should probably not be a landlord for very long.


Don't Discriminate Or Exclude Tenants Unfairly

Truth is, many landlords cherry pick their tenants - and they get away with it. But when they get caught, it's really painful, and expensive. It's not worth the risk. Know the laws in this area, and follow them. If your unit is not compliance with the lead paint laws be prepared to bring it into compliance or sell it if you have a tenant who needs to be in a lead safe unit.


Be Careful of Taking Deposits

Taking deposits before you evaluated a tenant can create confusion - and potential legal issues. Evaluate first, take the checks later. And just because they have a dog, you can't collect a pet deposit over and above a security deposit. That's not legal in MA. One months rent is the limit, and that deposit must be in a separate account that bears interest.


Have A Good Record of the Condition of the Property when they move In

Take a video of the unit - with the tenant if possible (make sure you capture them in the frame). It's hard to dispute video evidence, which is much better than a one page "statement of condition"


Get the Utilities Separated

I'm in so many buildings where the landlord is paying for heat and hot water, and sometimes electricity, because the utilities aren't separated. Not only will this make your units more valuable on resale, it also will allow you to charge higher rent (on a net basis). Tenants don't leave the lights on when they pay the bill. They don't run A/C when they aren't home. And they don't turn the heat up to 80 and then open a window when its their money. There is no downside here.


Check In When You Can - and Often if you Must

Keeping an eye on the tenants is a must, to see that they are taking care of the place. You don't have to wait until the end of the lease to check for damage, and if you find damage (a ripped carpet or painted wall) you can charge them to fix it. Most landlords don't want to cause trouble, but you need to be clear about the rules - and be clear that you'll enforce them. Now, don't be petty: Normal wear and tear isn't damage in most cases. We should be talking about things that are hundreds of dollars - not small items.


How do I get rid of tenants who are a headache?

Some tenants expect hotel like service from their landlord. If you have one of these, charge them hotel like prices for the service. Notify them (in advance of the lease end date) that the new lease will be far more expensive than the old one, to help pay for expenses related to their tenancy. They'll move.


What if the Tenants Stop Paying me?

First, know your rights. Second, know your obligations under the law. There are a lot of statutory (legal) obligations that you MUST follow to keep your options open. Some of them cost money, but are way cheaper than a tenant who isn't paying you for six months. Whatever you do, do it fast. Many landlords beg, plead, ask, accept promises and the like. These rarely solve the problem - they just extend your losses. If you think that the non-payment issue is going to last more than a few weeks, get serious and buy them out - pay them to leave. While this is very painful, if you screen your tenants carefully, you will not have to do this often - but you should always be prepared to do it. Evicting someone is always an option, but it makes people angry, and doesn't solve your cash flow problem. Getting them to leave voluntarily is faster, puts your property less at risk, is less stressful, and often cheaper in the long run.


Have Cash for Emergencies

Things happen, and money fixes them. The faster they get fixed, the less they cost. Don't get caught strapped for cash - that's when you'll need it most.


Be Prepared for Headaches at the Worst Times

It can't be helped: Property management usually means you'll be bothered when you can least afford to be bothered. Property management isn't risk-free, and it certainly isn't effort free, although sometimes it feels like that. Recognize it's part of the job and you'll get better at it. As the years move by, you'll see that your effort has been rewarded with a significant second income stream, and that might just make it all worth it.

Most Googled Postings!!

About Matt Heisler

Matt Heisler is a real-estate professional and owner of this website. He has been selling homes in MA for buyers and sellers for over 20 years. He is an expert in foreclosure purchases, short-sale purchases, short-sale sales, buy and hold investing, fix and flip investing, and of course traditional residential home sales. He is happy to take questions as they pertain to real estate on Title V, Radon, Termites, Sump Pumps, Roofs, Foundations, Wells, Septic Systems, Cash-Flow, Staging, and a host of other housing issues. As a Vanderbilt University alumnus, he is proud to serve his local community.

*All information is posted in good faith and is assumed to be reliable, but may rely on third party information sources.
Sept. 23, 2014

Real Estate Sales for Hudson, MA - Home Sales and Real Estate Market Report (Sept, 2014)

The Hudson Homes For Sale Market Report

On to Hudson. Remember, we had a surprise up report in Clinton, that usually means good things for Hudson:

Can’t see the chart? You can find it Here .

What do we see? Well, we see rising inventories of homes for sale, but we also see very strong transaction volume. The HSI has stayed steady, in the low 130s, and that makes 5 reports above 120. That should translate to rising prices, and we see them in this report, with a big jump in prices from $171 to $163.  This report isn't the big rise from Clinton - but it's very strong, and although the rise in properties for sale is about to break 50, that looks pretty healthy to me.  75 maybe not so much, but 50 is OK.

What should active home buyers do in Hudson?

Buyers may be looking at the chart and thinking: "Maybe prices will slide this fall like last year?". Well - it's possible. But the other way to look at the chart is to see that high water market from last year as an outlier, and then you see steady rising of prices. I'm more inclined with this view - for the simple reason that the reports have been so steady, so strong in Hudson that I would think most of the "bottom" is gone, and as prices recover you see nicer homes come on the market, and they have higher prices. Buyers have choices, but they still need to be aggressive, or the right house will go to someone else. This is also getting to look like a good "flip" market, with prices moving in the right direction.


Find Your Next Home or Check out the Competition!


What should potential home sellers do in Hudson?

Well, its a good time to get out there. Prices are strong, and buyers across the board look motivated. Most sellers are optimistic prices are going up, and I am too.


Hudson Houses For Sale and Sold Market Statistics - Raw MLS Data

  • Hudson‘s “Home Seller Index” (HSI): 133 Last Report: 132
  • There are 48 homes listed as For Sale.

    Home Prices are hot in Hudson, up 5% from the

    last report.

  • There have been 116 houses sold in the last 6 months, and 72 homes sold in the last 3 months in Hudson.
  • The Average number of Days on Market was 79 days for just SOLD homes.
  • There is an Average Market Time of 100 days of the Hudson homes For Sale (currently for sale).
  • The amount that was paid in Dollars per Square Foot averaged $171 (vs. $163 )
  • Current sellers are looking for $182 /sq foot
  • There was an Average Sold Price of $329,514 for sold homes.
  • Hudson, MA, has 1 properties advertised as lender owned or foreclosure (typically foreclosure) .
  • There are 3 properties advertised as a short-sale is going to be needed by the lender.


*All statistics are for Single Family Houses and based on data in MLS. Matt’s HSI is proprietary, and is designed to offer town-by-town information, instead of large scale trends. (That means you won’t find it anywhere else. Take that, Case-Schilling!).


Most Googled Postings!!

About Matt Heisler

Matt Heisler is a real-estate professional and owner of this website. He has been selling homes in MA for buyers and sellers for over 20 years. He is an expert in foreclosure purchases, short-sale purchases, short-sale sales, buy and hold investing, fix and flip investing, and of course traditional residential home sales. He is happy to take questions as they pertain to real estate on Title V, Radon, Termites, Sump Pumps, Roofs, Foundations, Wells, Septic Systems, Cash-Flow, Staging, and a host of other housing issues. As a Vanderbilt University alumnus, he is proud to serve his local community.

*All information is posted in good faith and is assumed to be reliable, but may rely on third party information sources.

Posted in Westborough, MA