General Index 

General House Hunting Articles

Things about Housing Everyone Should Know

Good Towns for Buyers, Good Towns for Sellers

Home Buying, Step by Step

Common Housing Problems and What to Do

Financing

Common Expenses when Buying or Selling Homes

After You Move In

Remodeling Slideshows for Kitchens, Baths, and others!

Newsletters

May 15, 2016

Real Estate Sales for Hopkinton, MA - Home Sales and Real Estate Market Report (April, 2016)

The Hopkinton Homes For Sale Market Report

A funny thing happened on the way to the Spring Home Market.


Buyers held their collective ground on price increases.


This is a the latest in a series that shows home prices actually falling in the early spring, despite monstrously tight home buying conditions. Home sellers - as optimistic as ever  - are getting the message that reaching for prices won't work, and are cutting prices.  What's going on?

Can’t see the chart? You can find it Here .

There are several things, but they all revolve around one central element:

Home prices in many communities have advanced as far as they can, at least for the moment. There simply aren't enough buyers at certain price points for valuations to keep going up.


Think of it this way, at each price point, the number of buyers gets smaller. Let's say there's 100 buyers for every house at $300, 000. At $400,000, there's 80 buyers. At 600,000 there's just 50 buyers, and at 800,000 there's just 20 buyers. Home values have pushed out of reach of the number of buyers that can afford them, or, if you like, home prices have advanced past the point where most buyers are willing to purchase.


There are lots of buyers out there - lots - but there's not enough of them to keep pushing prices up. They are more budget conscious than ever.

What should active home buyers do in Hopkinton?

Let's look further at this economic disparity - because it plays into what you should do as a home buyer. In Hopkinton, there are just 15 homes under 500,000. There are 35 above 800 - almost half the market total of 81. If you look at the HSI, things look like they've worsened for home sellers, but that is only true above 800 or so. At that level, as a home buyer, you have your pick of choices, and plenty of motivated sellers. Under 500? Not so much. Those homes are moving fast, and the forecast is that they will continue to do so.


Find Your Next Home or Check out the Competition!


What should potential home sellers do in Hopkinton?

KNOW YOU MARKET! Not just the town wide statistics, but your micro-market, as I like to call it. Not every home in Hopkinton will be easy to sell - and many are not selling. The average days on market for the active homes above 800 in Hopkinton is 250 days. Now that number is muddled a bit with new construction, but you are certainly no where near the average sale at under 60. Luxury home owners need to price right, and get their home ready to go from the beginning.


Hopkinton Houses For Sale and Sold Market Statistics - MLS Data


  • The Hopkinton “Home Seller Index” (HSI): 131 Last Report: 156
  • There are 81 homes actively listed as For Sale for Home Buyers.
  • In the last 6 months, there have been 154 houses sold, and 108 homes sold in the last 3 months in Hopkinton.
  • The Average number of Days on Market was 159 days for recently SOLD homes.
  • There is an Average Market Time of 143 days of the Hopkinton homes For Sale (currently for sale).
  • The amount that was paid by Home buyers in Dollars per Square Foot averaged $218 (vs. $220   in the last report)
  • Current home sellers are looking for $241 /sq. foot
  • There was an Average Sold Price of $642,856 .
  • Hopkinton , MA, has 0 properties advertised as lender owned or foreclosure (typically foreclosure) .
  • There are 0 properties advertised as a short-sale is going to be needed by the lender.


All raw data are for Single Family Houses and based on data in MLS. Matt’s HSI is proprietary*, and is designed to offer town-by-town information, instead of large scale trends.

*That means you won’t find it anywhere else. Take that, Case-Schilling!.


Don’t Go Just Yet! More Information for you…

About Matt Heisler

Matt Heisler is a real-estate professional and owner of this website. He has been selling homes in MA for buyers and sellers for over 20 years. He is an expert in foreclosure purchases, short-sale purchases, short-sale sales, buy and hold investing, fix and flip investing, and of course traditional residential home sales. He is happy to take questions as they pertain to real estate on Title V, Radon, Termites, Sump Pumps, Roofs, Foundations, Wells, Septic Systems, Cash-Flow, Staging, and a host of other housing issues. As a Vanderbilt University alumnus, he is proud to serve his local community.

*All information is posted in good faith and is assumed to be reliable, but may rely on third party information sources.
Posted in Hopkinton MA
May 10, 2016

Real Estate Sales for Holliston, MA - Home Sales and Real Estate Market Report (April, 2016)

The Holliston Homes For Sale Market Report

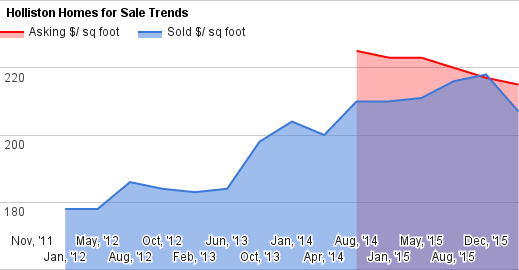
Holliston is continuing the trend where buyers are retrenching. Even though it's May, we can't see what activity April might have had on prices. One would think things have stablized, but this is an odd pattern for spring, and we're seeing a lot of it:

Home Buyers are being patient, and demanding price cuts.  Will it last through June?  

Can’t see the chart? You can find it Here .


What should active home buyers do in Holliston?

Home buyers should recognize that values are already below last year - and should be aggressive in scooping them up, before prices recover. Inventory has gotten better - it's not great, the number of homes for sale is still thin - but it's better than it was six weeks ago, that's for sure. That may not last - and it typically doesn't.


Find Your Next Home or Check out the Competition!


What should potential home sellers do in Holliston?

This is more difficult - but reaching too high for a price has been a bad strategy this year. Too many overpriced properties means you'll be cutting prices with the pack. Better to sell quick, than get caught up in the wave of stale inventory that many people will find themselves in June.


Holliston Houses For Sale and Sold Market Statistics - MLS Data


  • The Holliston “Home Seller Index” (HSI): 166 Last Report: 181
  • There are 47 homes actively listed as For Sale for Home Buyers.
  • In the last 6 months, there have been 143 houses sold, and 101 homes sold in the last 3 months in Holliston.
  • The Average number of Days on Market was 57 days for recently SOLD homes.
  • There is an Average Market Time of 102 days of the Holliston homes For Sale (currently for sale).
  • The amount that was paid by Home buyers in Dollars per Square Foot averaged $207 (vs. $218   in the last report)
  • Current home sellers are looking for $215 /sq. foot
  • There was an Average Sold Price of $488,813 .
  • Holliston, MA, has 1 properties advertised as lender owned or foreclosure (typically foreclosure) .
  • There are 0 properties advertised as a short-sale is going to be needed by the lender.


All raw data are for Single Family Houses and based on data in MLS. Matt’s HSI is proprietary*, and is designed to offer town-by-town information, instead of large scale trends.

*That means you won’t find it anywhere else. Take that, Case-Schilling!.


Don’t Go Just Yet! More Information for you…

About Matt Heisler

Matt Heisler is a real-estate professional and owner of this website. He has been selling homes in MA for buyers and sellers for over 20 years. He is an expert in foreclosure purchases, short-sale purchases, short-sale sales, buy and hold investing, fix and flip investing, and of course traditional residential home sales. He is happy to take questions as they pertain to real estate on Title V, Radon, Termites, Sump Pumps, Roofs, Foundations, Wells, Septic Systems, Cash-Flow, Staging, and a host of other housing issues. As a Vanderbilt University alumnus, he is proud to serve his local community.

*All information is posted in good faith and is assumed to be reliable, but may rely on third party information sources.

Posted in Holliston, MA
April 25, 2016

Real Estate Sales for Grafton, MA - Home Sales and Real Estate Market Report (April, 2016)


The Grafton Homes For Sale Market Report

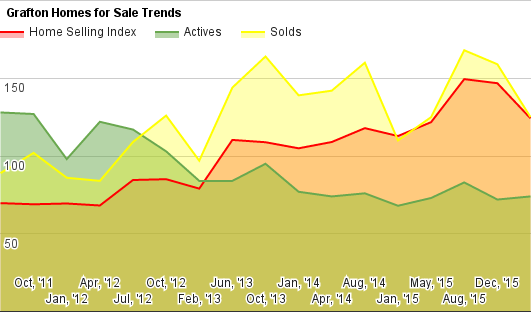
Grafton looks pretty good.  Sellers are growing in optimism, reaching for higher prices.  As we've seen recently, buyers remain dug in at previous price levels.  This should mean that inventor levels should grow, unless the buyers cave in a start buying current prices.

Home sellers are a bit ahead of the home buyers -

who are trying to put the breaks on home prices

Can’t see the chart? You can find it Here .


What should active home buyers do in Grafton ?

Home buyers have some decent choices in Grafton in several price ranges.  More than most towns, anyhow.  Things aren't moving quite as quick either, with market time about 60% more for recent sales than the more competitive towns.  Still, the good ones move fast, and the great ones go faster.

Find Your Next Home or Check out the Competition!


What should potential home sellers do in Grafton ?

Home sellers are seeing some good activity, and some good demand.  This market isn't tight enough to be asking for big bumps in prices though, that hasn't happened yet.  Inventory remains near the lows, and will keep pressure on prices, and some prices ranges are very thin  - and will be great for sellers.

Things have cooled off a little, but inventories remain tight, a week before May


Grafton Houses For Sale and Sold Market Statistics - MLS Data

  • The Grafton “Home Seller Index” (HSI): 124 Last Report:147
  • There are 74 homes actively listed as For Sale for Home Buyers.
  • In the last 6 months, there have been 125 houses sold, and 83 homes sold in the last 3 months in Grafton.
  • The Average number of Days on Market was 55 days for recently SOLD homes.
  • There is an Average Market Time of 363 days of the Grafton homes For Sale (currently for sale).
  • The amount that was paid by Home buyers in Dollars per Square Foot averaged 180 (vs. 185 in the last report)
  • Current home sellers are looking for $ 198 /sq foot
  • There was an Average Sold Price of $384,553 .
  • Grafton , MA, has 0 properties advertised as lender owned or foreclosure (typically foreclosure) .
  • There are 1 properties advertised as a short-sale is going to be needed by the lender.


All raw data are for Single Family Houses and based on data in MLS. Matt’s HSI is proprietary*, and is designed to offer town-by-town information, instead of large scale trends.

*That means you won’t find it anywhere else. Take that, Case-Schilling!.


Don’t Go Just Yet! More Information for you…

About Matt Heisler

Matt Heisler is a real-estate professional and owner of this website. He has been selling homes in MA for buyers and sellers for over 20 years. He is an expert in foreclosure purchases, short-sale purchases, short-sale sales, buy and hold investing, fix and flip investing, and of course traditional residential home sales. He is happy to take questions as they pertain to real estate on Title V, Radon, Termites, Sump Pumps, Roofs, Foundations, Wells, Septic Systems, Cash-Flow, Staging, and a host of other housing issues. As a Vanderbilt University alumnus, he is proud to serve his local community.

*All information is posted in good faith and is assumed to be reliable, but may rely on third party information sources.
Posted in Grafton, MA
April 7, 2016

What is a pre-foreclosure home and How do I buy it?

What is a pre-foreclosure home?

A pre-foreclosure is a home where the home owners are late paying their mortgage. They are late enough where the bank has decided to protect it's right to foreclosure by filing a notice of intent to

Pre-foreclosures are rarely home owners

who want to sell.

foreclose, or "pre-foreclosure" notice. The banks must do this if they intend to foreclose, so they often do this as early as possible. It is important to understand that pre-foreclosures are NOT foreclosed homes. They are still owned by the home owner, and being late on your mortgage doesn't give the bank the right to sell the property.


Where can I find pre-foreclosures homes?

There is a company called Realty-Trac which manages a database of these pre-foreclosure notices, and offers them to websites, like Trulia, Depending on the website, various information is available for free, and more specific information behind paywalls.


How can I buy pre-foreclosures homes?

This is where many novice home buyers get confused. Very few home owners in pre-foreclosure want to sell. Many of them fully intend to catch up on their mortgage payments and stay put. Even those that are in serious financial trouble aren't interested in selling, because they don't have anywhere to go! They can't just rent somewhere, they are in financial trouble. Although many resolve their deficiencies with the bank, some may chose to stay put until foreclosed on. However that process takes months, and sometimes years, to play out, and even AFTER the property is foreclosed, it is not unusual for the bank to take even more time to get the property ready for sale.


A small percentage of pre-foreclosure folks are interested in selling, and you can write an offer to purchase their home. If the home is on the market, this is easy, but if it isn't on the market, you must connect with the homeowner directly and ask if you can see their home because you'd like to buy it. Because so few pre-foreclosure home owners are interested in selling, be prepared to use a lot of stamps!


Manage your time as well

as your money and you

may not feel pre-foreclosures


are a worthwhile pursuit.

Will buying a pre-foreclosure home save me money?

If you can find an owner willing to sell, and if you can offer them less than market, and if they take it, then yes. But that is a lot of ifs. The bigger problem is that this is a low percentage game, and it may not proceed at the pace you would like.


Don’t Go Just Yet! More Information for you…

About Matt Heisler

Matt Heisler is a real-estate professional and owner of this website. He has been selling homes in MA for buyers and sellers for over 20 years. He is an expert in foreclosure purchases, short-sale purchases, short-sale sales, buy and hold investing, fix and flip investing, and of course traditional residential home sales. He is happy to take questions as they pertain to real estate on Title V, Radon, Termites, Sump Pumps, Roofs, Foundations, Wells, Septic Systems, Cash-Flow, Staging, and a host of other housing issues. As a Vanderbilt University alumnus, he is proud to serve his local community.

*All information is posted in good faith and is assumed to be reliable, but may rely on third party information sources.

April 6, 2016

Radon in Water, Lead Paint and Asbestos: Which is the most dangerous household problem?


Dangerous Substances in Your Home: Radon, Radon in Well Water, Lead Paint, Asbestos and Carbon Monoxide

There are many dangers in your home. But there's also a lot of misinformation as well. For most folks, buying a home is an emotional decision, more than it is a rational decision, but for those who want to be informed about the actual relative dangers of certain items commonly found in homes, this is the post for you.


Lead Poisoning

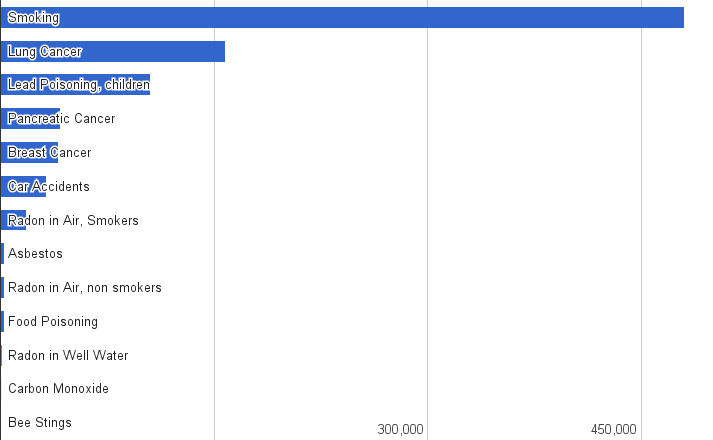
In New England, there are many homes with lead paint. It's been known to be dangerous to children for almost two generations now. It's been out of use for almost 50 years, but it is still not illegal to own, buy or sell a home with lead paint*. Although, from what I can tell, lead paint rarely kills anyone, the impacts can be deadly serious, so it is certainly no lightweight when it comes to the home dangers. In fact, it checks in as the number one danger in housing according to the items I looked at in this post.  After the disaster in Flint, Michigan, we should all be aware that lead can also come in via municipal water, if the folks running the public water systems aren't careful.  Paint is not the only avenue for lead poisoning, unfortunately.


Asbestos

You can't watch too much TV without seeing an ad for Mesothelioma sufferers. Prolonged exposure to Asbestos can lead to this very specific type of cancer. Asbestos, of course, has been banned across the country for decades, but the original usefulness of the product means that we are still finding it in homes today. Removing it is expensive (although not prohibitively so), and should be done by experts. It is estimated that Asbestos exposure is responsible for 3000 deaths a year, but it should be noted that the number of deaths responsible due to a home's asbestos is far less, although there are not good numbers for it (at least none that I could find). The vast majority of incidents are from those who have worked in shipping and other heavy industries, where asbestos was common, and where they were exposed to it daily over many years. I've put the Nationwide number for asbestos in the chart, but as noted, getting mesothelioma from asbestos in the home seems to be very rare.  That certainly means home owners should be aware of *where* it is, and *how* to (not) handle it, and the options for remediation.  However, they probably don't need to rule out a house over it.


Smoking, of course, is far more dangerous than any of the dangerous substances in your home.

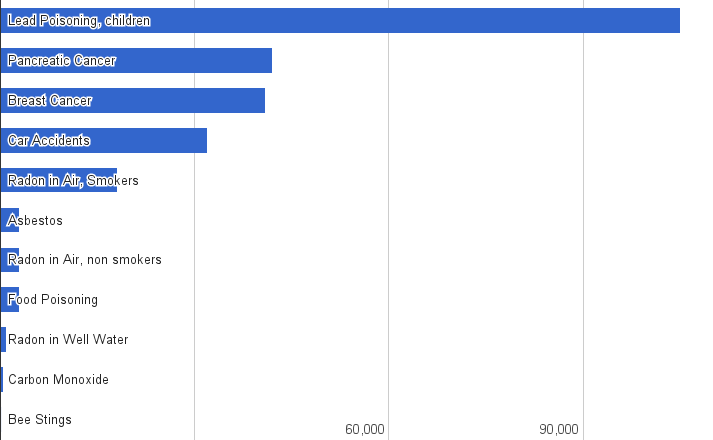
Far and away though, for household dangers, lead paint has the widest impact. The dangers from

Carbon Monoxide are close in scale to Bee Stings, and Radon in Well Water is not much more dangerous.


Carbon Monoxide

It's a law now in Massachusetts for all homes to have carbon monoxide detectors working in the home when it is sold. Across the country though, Carbon Monoxide is one of the smaller causes of death, so it barely even shows up in the chart.  Here, I'll drop smoking off the top so we can see the smaller items better:


Here's the same chart without smoking, which makes the other items look bigger.

Car accidents are far more dangerous than most home dangers, even when not mitigated, so please,

buckle up for safety!


Radon


Radon can get into your home a couple of different ways. The most common - and dangerous - is through the air. Systems to mitigate this are easily installed and are low cost in most cases. Note that according to the chart, smokers are at much greater risk of getting sick from Radon than non-smokers. MUCH greater. Radon, like smoking, takes years to have an impact, but over years it can have a significant one. Radon can also get into your well water. Currently, the EPA doesn't have a national standard for what is dangerous radon levels in well water, but several states, including Massachusetts, do have recommended mitigation levels. Mitigation is expensive for well water, but very effective. I broke down the Radon information into several groups, Smokers with Radon-in-air exposure, Non-smokers with air exposure, and then the CDC's best guess at Radon in Water deaths, which is very, very low, and looks like a calculated guess.


The Radon numbers are  - I would think - probably going to start coming down, as more and more homes are now having at least an one test at some point.  As more homes get tested and mitigated, there should be fewer and fewer long term exposure issues, which should drive the numbers down.


Conclusions

There are many things that we probably don't think about enough - like smoking and car accidents - that while we feel they are safe, are much more dangerous than many of the dangers that are in our homes.  First time home buyers, confronted with these risks for the first time, should certainly use this data to understand the relative dangers.  With a little knowledge and care, these items won't come back to bite you.


*There are, of course, laws against having young children in a home where lead paint is present, however.

Don’t Go Just Yet! More Information for you…

About Matt Heisler

Matt Heisler is a real-estate professional and owner of this website. He has been selling homes in MA for buyers and sellers for over 20 years. He is an expert in foreclosure purchases, short-sale purchases, short-sale sales, buy and hold investing, fix and flip investing, and of course traditional residential home sales. He is happy to take questions as they pertain to real estate on Title V, Radon, Termites, Sump Pumps, Roofs, Foundations, Wells, Septic Systems, Cash-Flow, Staging, and a host of other housing issues. As a Vanderbilt University alumnus, he is proud to serve his local community.

*All information is posted in good faith and is assumed to be reliable, but may rely on third party information sources.

April 5, 2016

Real Estate Sales for Clinton, MA - Home Sales and Real Estate Market Report (April, 2016)

The Clinton Homes For Sale Market Report

A quick look at the pricing map in Clinton gives a "what the heck is happening here". This chart doesn't look like any other chart. Prices paid are down, and asking prices are way down. I'll admit - I'm not 100% sure, but I have some theories.

On the surface, the pricing activity in Clinton makes no sense

compared to the overall market in Massachusetts.

Can’t see the chart? You can find it Here .

Clinton is a smaller town, and doesn't have a lot of inventory, even when things are bad (it peaked out at 67). This makes its secondary numbers, like prices, more volatile. But what's causing the volatility?  I'm pretty sure it's the bank impacted inventory. Out of 20 homes for sale, 8 are either bank owned or short-sales, and those are the highest raw numbers we've seen since 2014, and the highest percentage since we've been tracking. Those prices are often "distressed" prices, pulling things down. Paradoxically though, it means things in Clinton are doing better - banks think the market is good enough to unload distressed inventory for fair prices. Eventually, they will run out, and when they do, prices should reflect more normal patterns (which should be markedly higher). At any rate, that's the theory.


What should active home buyers do in Clinton?

Break out your hammer! With a lot of distressed inventory, there are deals in this part of the market, and with things getting tight, profits are there for those willing to roll up their sleeves. Otherwise, be patient, prices are good in Clinton, and eventually headed higher, so it's a great time to be aggressive.


Find Your Next Home or Check out the Competition!


What should potential home sellers do in Clinton?

Pricing is very difficult in this market; it's thin, and there are not many good comparables. But if you have a home ready to go, you'll find lots of buyers. Unlike the pricing graph, the HSI graph is quite clear, the market has never been this good for sellers, and buyers are very, very aggressive right now. Make sure your home looks it's best, and you can sell fast!

Falling inventory and climbing transactions show the true market in Clinton,

with demand heating up, and prices on their way as well.


Clinton Houses For Sale and Sold Market Statistics - MLS Data


  • The Clinton “Home Seller Index” (HSI): 158 Last Report: 150
  • There are 20 homes actively listed as For Sale for Home Buyers.
  • In the last 6 months, there have been 63 houses sold, and 41 homes sold in the last 3 months in Clinton.
  • The Average number of Days on Market was 73 days for recently SOLD homes.
  • There is an Average Market Time of 98 days of the Clinton homes For Sale (currently for sale).
  • The amount that was paid by Home buyers in Dollars per Square Foot averaged $129 (vs. $138   in the last report)
  • Current home sellers are looking for $128 /sq foot
  • There was an Average Sold Price of $207,975 .
  • Clinton, MA, has 4 properties advertised as lender owned or foreclosure (typically foreclosure) .
  • There are 4properties advertised as a short-sale is going to be needed by the lender.


All raw data are for Single Family Houses and based on data in MLS. Matt’s HSI is proprietary*, and is designed to offer town-by-town information, instead of large scale trends.

*That means you won’t find it anywhere else. Take that, Case-Schilling!.


Don’t Go Just Yet! More Information for you…

About Matt Heisler

Matt Heisler is a real-estate professional and owner of this website. He has been selling homes in MA for buyers and sellers for over 20 years. He is an expert in foreclosure purchases, short-sale purchases, short-sale sales, buy and hold investing, fix and flip investing, and of course traditional residential home sales. He is happy to take questions as they pertain to real estate on Title V, Radon, Termites, Sump Pumps, Roofs, Foundations, Wells, Septic Systems, Cash-Flow, Staging, and a host of other housing issues. As a Vanderbilt University alumnus, he is proud to serve his local community.

*All information is posted in good faith and is assumed to be reliable, but may rely on third party information sources.
Posted in Clinton, MA
April 3, 2016

Real Estate Sales for Charlton, MA - Home Sales and Real Estate Market Report (April, 2016)

The Charlton Homes For Sale Market Report

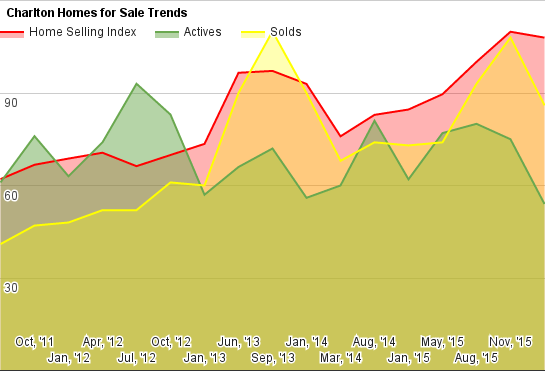
A quick look at the price activity shows a steady as they go report. Consitent ask prices, and consitent sale prices. But if we look closer, at the data behind the front line numbers, we see things getting tougher for buyers.

Can’t see the chart? You can find it Here .

The first thing I noticed was that sales in the last three months were much stronger than the 3 months before that. In most towns, it's remained balance. This shows us however, that buyers are swarming in to Charlton, and it's probably for two reasons: 1) They had houses to buy 2) They like the prices. This activity is normally what we see before a run in home prices. Let's keep looking for more evidence.

What should active home buyers do in Charlton?

Home buyers, if they look at the chart below, will see inventory reached a new low - meaning the supply of homes for sale is the lowest it's been in Charlton since we've been tracking. This is not just in Charlton, of course, we're seeing this everywhere, but if the trend holds, we'll see higher prices in Charlton before the spring is out. Buyers should not be complacent - the market looks tight, and will likely be very competitive this year for homes in good locations in good condition.


What should potential home sellers do in Charlton?

Home sellers should be excited. The HSI has been above 100 3 reports in a row, and with inventory plummeting, that's good news for seller. And there's more. Day on market for successful sales is also down, and is about half where it was just 3 years ago. Things are moving, and they are likely to improve for sellers.


Charlton Houses For Sale and Sold Market Statistics - MLS Data


  • The Charlton “Home Seller Index” (HSI): 108 Last Report: 110
  • There are 54 homes actively listed as For Sale for Home Buyers.
  • In the last 6 months, there have been 86 houses sold, and 51 homes sold in the last 3 months in Charlton.
  • The Average number of Days on Market was 74 days for recently SOLD homes.
  • There is an Average Market Time of 195 days of the Charlton homes For Sale (currently for sale).
  • The amount that was paid by Home buyers in Dollars per Square Foot averaged $149 (vs. $149   in the last report)
  • Current home sellers are looking for $ 195 /sq foot
  • There was an Average Sold Price of $298,519 .
  • Charlton, MA, has 0 properties advertised as lender owned or foreclosure (typically foreclosure) .
  • There are 2 properties advertised as a short-sale is going to be needed by the lender.


All raw data are for Single Family Houses and based on data in MLS. Matt’s HSI is proprietary*, and is designed to offer town-by-town information, instead of large scale trends.

*That means you won’t find it anywhere else. Take that, Case-Schilling!.


Don’t Go Just Yet! More Information for you…

About Matt Heisler

Matt Heisler is a real-estate professional and owner of this website. He has been selling homes in MA for buyers and sellers for over 20 years. He is an expert in foreclosure purchases, short-sale purchases, short-sale sales, buy and hold investing, fix and flip investing, and of course traditional residential home sales. He is happy to take questions as they pertain to real estate on Title V, Radon, Termites, Sump Pumps, Roofs, Foundations, Wells, Septic Systems, Cash-Flow, Staging, and a host of other housing issues. As a Vanderbilt University alumnus, he is proud to serve his local community.

*All information is posted in good faith and is assumed to be reliable, but may rely on third party information sources.
Posted in Charlton, MA
April 2, 2016

Real Estate Sales for Framingham, MA - Home Sales and Real Estate Market Report (April, 2016)

The Framingham Homes For Sale Market Report

Framingham checks in with a market under pressure - but buyers have resisted taking prices higher. Inventory has been just enough to let them do so. Not sure what happens in May, although there's a little more inventory coming on.


Can’t see the chart? You can find it Here .


What should active home buyers do in Framingham?


Active home buyers should be aware it's a tough market; with average offer times under 40 days, that's about as tight as it gets.  Very little is fairly price, most is reaching a bit, but the homes that are close to market value are moving quickly.  Home Buyers may find more value in surrounding towns, and less competition.


Find Your Next Home or Check out the Competition!


What should potential home sellers do in Framingham?

Home sellers should be aware that the buyers  - so far - have been stingy.  Home sellers who have reached to far ahead of the price curve this spring have, for the most part, not been successful.  Getting your home to look it's brightest and biggest still matters, but there's certainly plenty of buyers.


Framingham Houses For Sale and Sold Market Statistics - MLS Data


  • The Framingham “Home Seller Index” (HSI): 237 Last Report: 262
  • There are 75 homes actively listed as For Sale for Home Buyers.
  • In the last 6 months, there have been 374 houses sold, and 214 homes sold in the last 3 months in Framingham.
  • The Average number of Days on Market was 39 days for recently SOLD homes.
  • There is an Average Market Time of 90 days of the Framingham homes For Sale (currently for sale).
  • The amount that was paid by Home buyers in Dollars per Square Foot averaged $210 (vs. $216   in the last report)
  • Current home sellers are looking for $227 /sq. foot
  • There was an Average Sold Price of $399,318 .
  • Framingham, MA, has 1 properties advertised as lender owned or foreclosure (typically foreclosure) .
  • There are 1 properties advertised as a short-sale is going to be needed by the lender.


All raw data are for Single Family Houses and based on data in MLS. Matt’s HSI is proprietary*, and is designed to offer town-by-town information, instead of large scale trends.

*That means you won’t find it anywhere else. Take that, Case-Schilling!.


Don’t Go Just Yet! More Information for you…

About Matt Heisler

Matt Heisler is a real-estate professional and owner of this website. He has been selling homes in MA for buyers and sellers for over 20 years. He is an expert in foreclosure purchases, short-sale purchases, short-sale sales, buy and hold investing, fix and flip investing, and of course traditional residential home sales. He is happy to take questions as they pertain to real estate on Title V, Radon, Termites, Sump Pumps, Roofs, Foundations, Wells, Septic Systems, Cash-Flow, Staging, and a host of other housing issues. As a Vanderbilt University alumnus, he is proud to serve his local community.

*All information is posted in good faith and is assumed to be reliable, but may rely on third party information sources.

Posted in Framingham, MA
March 23, 2016

Real Estate Sales for Boylston, MA - Home Sales and Real Estate Market Report (Mar, 2016)

The Boylston Homes For Sale Market Report

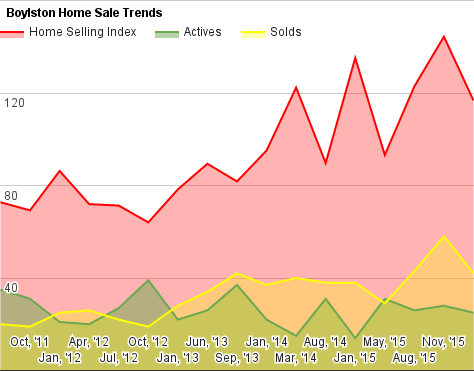
Hold on there Boylston Home sellers! I think we may have gotten a bit ahead of ourselves...

Can’t see the chart? You can find it Here .

So... What's going on? Well, most of what is available in Boylston is New Construction. And the market is good, so builders are figuring out what they can charge there. But it's distorting the price activity in Bolyston. If you look at the data below, you'll see that the time on market is rising steadily - and it will continue - as new construction has long sales cycles when it's priced this far ahead of the market.

What should active home buyers do in Boylston?

Be aware that the new construction is pricey relative to pre-existing home sales. It's worth reviewing what's out there, just to make sure you aren't over reaching. And check those spec sheets!

Find Your Next Home or Check out the Competition!


What should potential home sellers do in Boylston ?

As a home seller, I wouldn't worry too much. You're bound to look down right a great value compared to the existing new construction, and will get a lot of attention, and sell for a great price! Yes, their aggressiveness could actually help you - as long as you don't over do it.


Boylston Houses For Sale and Sold Market Statistics - MLS Data


  • The Boylston “Home Seller Index” (HSI): 117 Last Report: 144
  • There are 25 homes actively listed as For Sale for Home Buyers.
  • In the last 6 months, there have been 42 houses sold, and 22 homes sold in the last 3 months in Boylston.
  • The Average number of Days on Market was 59 days for recently SOLD homes.
  • There is an Average Market Time of 191 days of the Boylston homes For Sale (currently for sale).
  • The amount that was paid by Home buyers in Dollars per Square Foot averaged 176 (vs. 166 in the last report)
  • Current home sellers are looking for $ 219 /sq foot
  • There was an Average Sold Price of $361,357 .
  • Boylston , MA, has 1 properties advertised as lender owned or foreclosure (typically foreclosure) .
  • There are 0 properties advertised as a short-sale is going to be needed by the lender.


All raw data are for Single Family Houses and based on data in MLS. Matt’s HSI is proprietary*, and is designed to offer town-by-town information, instead of large scale trends.

*That means you won’t find it anywhere else. Take that, Case-Schilling!.


Don’t Go Just Yet! More Information for you…

About Matt Heisler

Matt Heisler is a real-estate professional and owner of this website. He has been selling homes in MA for buyers and sellers for over 20 years. He is an expert in foreclosure purchases, short-sale purchases, short-sale sales, buy and hold investing, fix and flip investing, and of course traditional residential home sales. He is happy to take questions as they pertain to real estate on Title V, Radon, Termites, Sump Pumps, Roofs, Foundations, Wells, Septic Systems, Cash-Flow, Staging, and a host of other housing issues. As a Vanderbilt University alumnus, he is proud to serve his local community.

*All information is posted in good faith and is assumed to be reliable, but may rely on third party information sources.

Posted in Boylston, MA
March 20, 2016

Investing in Real Estate: How Market Cycles Affect Strategy

Real Estate Strategy Overview

There are many ways to invest in Real Estate. But the profitable ways (for the little guys) are different, depending on where we are in the real estate cycle. To help identify the cycles, I've broken them down with the following nomenclature. It should be noted, that in real estate, different towns can be at different stages of the market, depending on how far they are from the nearest Metro area. So you can have a situation where Natick is in a Frothy Market, but Sutton is in an early stage rebound. Knowing which market is in which stage is key to picking the right strategy to maximize returns.


Early Stage Residential Real Estate Rebound:
Homeowners, rejoice, the dark days are over. Characterized by risk aversion by the average home buyer, this it a point in the real estate cycle where property perceived as risky sells below its intrinsic

It's not a question of "buy and hold" or "fix and flip",

it's about the right strategy for the right part of the cycle.

value. Buyers begin to chase safe property with few flaws, and offering multiple bids for homes in good condition, appropriately priced, in desirable locations. This is a good market for "home flippers," but location needs to be scrutinized carefully.


Investors Should....


  • Owners of Condos/Duplexes Should: Keep renting them. Condo cycles are peak when single families are no longer available in mass supply. Further, rents typically increase during this period.
  • Owners of Multi-Families should: Keep renting them. Multi-family cycles are peak when new investors begin to hit the market and credit is loose. Neither are typically true at this stage. Further, rents typically increase during this period.
  • Flippers Should: This is a good flip market. Properties in good locations that need work are often overlooked, as supply is still large enough where most buyers will wait around. However, properties that are in A condition remain scarce, and home buyers pay Premiums.
  • Multi-family buyers Should: Purchase property. Rents are often low, and valuations are low. Both items will improve in the coming years.
  • Builders Should: Purchase land now, before prices normalize. If you can get financing.


Mid Stage Real Estate Market With Steadily Increasing Prices:
Characterized by reduction in risk aversion by the average home buyer; sales at most price ranges happen with in 180 days, supply and demand are equal, and prices have been in positive territory year-over-year. Developers are willing to build on spec in developments that exceed 5 houses on a more regular basis. This is a good market for spec housing, potentially fix and flipping, but the margins in flipping will be smaller. It may, or may not, in certain locations, be a good market for mulit-family to condo conversion flipping.


Investors Should....


  • Owners of Condos/Duplexes Should: Keep renting them. Condo cycles are peak when single families are no longer available in mass supply. Further, rents typically increase during this period.
  • Owners of Multi-Families should: Keep renting them. Multi-family cycles are peak when new investors begin to hit the market and credit is loose. Neither are typically true at this stage. Further, rents typically increase during this period.
  • Flippers Should: This is a tougher flip market. Properties in good locations that need work are no longer overlooked, reducing the margin for home flippers. Homes need to be really broken and busted for flippers to succeed, but these are risky properties, to be bought only when the Investor has a solid margin of safety. However, properties that are in A condition remain scarce, and home buyers pay Premiums.
  • Multi-family buyers Should: Purchase property. Rents are often low, and valuations are low. Both items will improve in the coming years.
  • Builders Should: Purchase land, but smaller single family lots will have seen prices normalize. More strategy is required about the end game, but rising home prices will probably protect margins.


Frothy Real Estate Market:
Often Characterized by median sales prices jumping at more than 5% a year, with inventory not keeping pace with supply. Bidding wars push prices up on good condition neighborhood homes, and homes elsewhere are below market prices. Buyers risk aversion decreases, as they focus on housing fitting their needs, and the lack of availability drives decision making. This is a good market for mulit-family to condo conversion flipping. It can be a good market for spec housing, but at this point land prices are jumping smartly, and caution needs to be maintained. Interest rate risk must be watched closely. Although banks should be restricting credit in this market, often, the reverse is true - lending increases.


Investors Should....


  • Owners of Condos/Duplexes Should: Get out! Sell now and 1031 exchange into something with more cash flow. Or sit tight on profits and wait for the next pull back.
  • Owners of Multi-Families should: If a 1031 exchange to a bigger building with more cash flow is possible, this is a good time. If condo -conversions are possible and a good idea for your building, that is an even better way to go. New investors begin to hit the market push prices up.   Further, rents typically increase during this period.
  • Flippers Should: This is a tougher flip market. Properties in good locations that need work are no longer overlooked, reducing the margin for home flippers. Homes need to be really broken and busted for flippers to succeed, but these are risky properties, to be bought only when the Investor has a solid margin of safety. However, properties that are in A condition remain scarce, and home buyers pay Premiums. If the end is near, Flippers should reduce standing inventory, so as not be caught when demand softens.
  • Multi-family buyers Should: Be cautious! Make sure cash flows are strong and the building doesn't need near term capital. Rents may stop going up and even fall in the next phase, and will burn those that are over extended.
  • Builders Should: Purchase land that is ready to go, as land with 2 or 3 year development cycle could come on when the market softens, crushing margins. Land is no longer cheap, and margins are thin, as every contractor with a hammer is now competing for the same pieces of land.


Falling Real Estate Market
Smart investors in falling markets raise cash, for two reasons: Prices in 6 months will be cheaper than they are now, and cash on hand allows the sidestepping of credit issues for purchases, which is important because credit quickly dries up in a falling market, as banks restrict lending. Investors do well at foreclosure auctions, short-sales, (both in a fix-or-flip mentality). but must be careful to build in extra margin to account for increase days on market and falling prices. Generally, condo conversions will not do well as the first-time buyers run for cover, and inventory in this market increases.


Investors Should....


  • Owners of Condos/Duplexes Should: Sell if you can, don't wait for the bottom. It is deep and long for these properties.
  • Owners of Multi-Families should: Sell if you can, don't wait for the bottom. It is deep and long for these properties. Avoid condo-conversions at all costs. Rents may decrease, and vacancy may as well. Cut rents to stave off vacancy. If the property is not over leveraged, you can hold and ride it out. Make sure cash flows are good; anticipate rental income decreases of 20%.
  • Flippers Should: Don't flip in a down market.
  • Multi-family buyers Should: Wait till the bottom of the cycle. There will be foreclosures, rehabs, and many properties available for a song when we get there.
  • Builders Should: Raise cash and wait for land prices to bottom.


Don’t Go Just Yet! More Information for you…

About Matt Heisler

Matt Heisler is a real-estate professional and owner of this website. He has been selling homes in MA for buyers and sellers for over 20 years. He is an expert in foreclosure purchases, short-sale purchases, short-sale sales, buy and hold investing, fix and flip investing, and of course traditional residential home sales. He is happy to take questions as they pertain to real estate on Title V, Radon, Termites, Sump Pumps, Roofs, Foundations, Wells, Septic Systems, Cash-Flow, Staging, and a host of other housing issues. As a Vanderbilt University alumnus, he is proud to serve his local community.

*All information is posted in good faith and is assumed to be reliable, but may rely on third party information sources.