General Index 

General House Hunting Articles

Things about Housing Everyone Should Know

Good Towns for Buyers, Good Towns for Sellers

Home Buying, Step by Step

Common Housing Problems and What to Do

Financing

Common Expenses when Buying or Selling Homes

After You Move In

Remodeling Slideshows for Kitchens, Baths, and others!

Newsletters

March 5, 2013

Where are the Hot Real Estate Markets in Metrowest this Spring?

Hottest Real Estate Markets in Metrowest Massachusetts


Here we go! Haven't updated in a while, but here's the chart. Remember, the chart shows us where the biggest imbalances are between sellers and buyers - not which markets are the most expensive. Towns get hot, towns go cold, and for buyers the values are in the towns that are cooler. For sellers, the best times to sell are when you're hot! Details can be found by clicking here on how the chart should be read, and you can compare that old chart to this one, if you'd like.


Any surprises here?  Not really.  But some little ones.  Medfield has really cooled off.  Holliston has made a big jump, and Milford latest chart is a surprise - some real bargain hunting going on in Milford.   I think Southborough and Westborough are going to move up, but I haven't done any charts for them recently, so we'll have to check back in the summer, but they certainly seem very busy.  Northborough and Upton are normally considered school friendly towns, but it looks as if buyers are not paying attention to them very much right now.  And Worcester is really a surprise, can't wait to see what prices are doing out there next week.

Posted in Massachusetts
March 4, 2013

Milford, MA - Home Sales and Real Estate Market Report (Feb, 2013)

The Milford Homes For Sale Market Report


The Milford Housing Chart looks all squiggly; is there any pattern here? There is. Focus on the green line. It basically is going down, pretty quickly. That's the number of homes for sale, and Milford is starting to run out of them. Strangely, prices have taken a breather, but that should be a short-term event (it's not a big drop, but bigger than you would expect given the decline of inventory.) Home Buyers have probably been focusing elsewhere, but they'll likely come back to Milford before long.


Also note the Red Line, which tracks my Home Seller Index. That has been moving upward, and today's report sets a record for Milford, at a super charged 111. It's not Natick, but who is? Home Sellers will get lots of traffic this spring, and even homes that need some work will get good offers.


Find Your Next Home or Check out the Competition!

In another positive development, short-sale and foreclosures are way down in Milford. There were sixteen bank impacted properties just two reports ago, and now we are down to just 7 - less than half.


Milford Houses For Sale and Sold Market Statistics - Raw MLS Data


  • There are 50 homes listed as For Sale in Milford.
  • There have been 105 houses sold in the last 6 months, and 55 homes sold in the last 3 months.

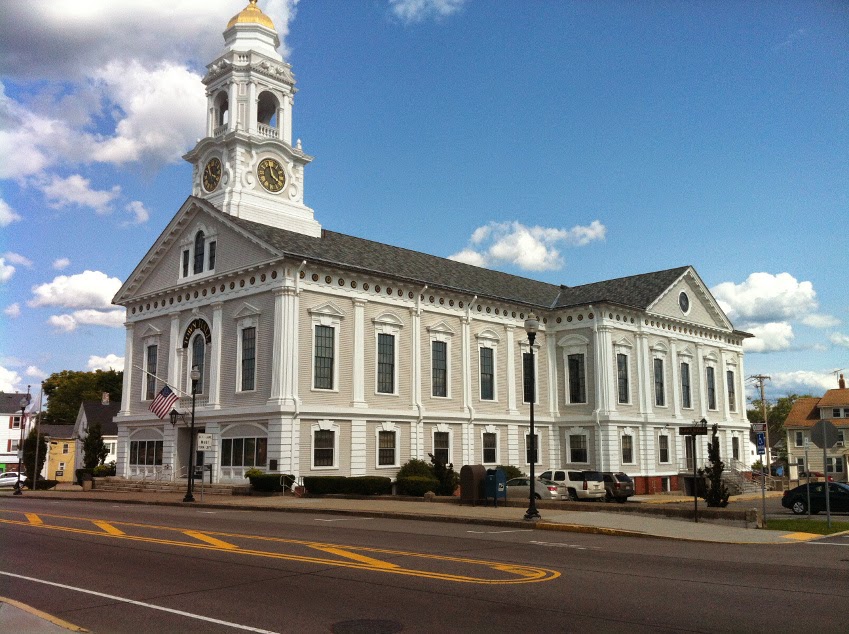
    Milford's Town Hall is dressed to impress. Lately,

    buyers have noticed.

  • The Average number of Days on Market was 108 days for just SOLD homes.
  • There is an Average Market Time of 139 days of the homes For Sale (currently for sale).
  • The amount that was paid in Dollars per Square Foot averaged $139 (vs. $144 )
  • There was an Average Sold Price of $245,149 for sold homes.
  • Milford has 3 properties (vs. 5 in the last report)advertised as lender owned/foreclosure (typically foreclosure) .
  • Milford has 4 properties (vs. 6) advertised as a short-sale is going to be needed by lender .
  • Milford “Home Seller Index” (HSI):111Last Report:103


*All statistics are for Single Family Houses and based on data in MLS.


Our Most Requested Posts

About Matt Heisler

Matt Heisler is a real-estate professional and owner of this website. He has been selling homes in MA for buyers and sellers for over 20 years. He is an expert in foreclosure purchases, short-sale purchases, short-sale sales, buy and hold investing, fix and flip investing, and of course traditional residential home sales. He is happy to take questions as they pertain to real estate on Title V, Radon, Termites, Sump Pumps, Roofs, Foundations, Wells, Septic Systems, Cash-Flow, Staging, and a host of other housing issues. As a Vanderbilt University alumnus, he is proud to serve his local community.

Do Good Things Today! Matt Heisler

*All information is posted in good faith and is assumed to be reliable, but may rely on third party information sources.

Posted in Milford, MA
March 1, 2013

Sherborn: Market Update ( By Request)

Sherborn, MA - Home Sales and Real Estate Market Report (Mar, 2013)

The Sherborn Homes For Sale Market Report


This is a special report going out to a fan of the blog, who wished that I had Sherborn in the regular rotation that I covered. (Hey, I can't do the whole state!). But I can certainly take a peak at various towns from time to time. So here's a current snapshot of Sherborn.


The stats are below, and I have to admit, after looking at a whole bunch of very similar reports, Sherborn's was nothing like any other town I cover. Let's start at the most important stat. The HSI, or Home Seller Index. 66? A paltry 66? That indicates a buyers market in Sherborn. What? Desirable Sherborn? That makes no sense to me. Then I looked at market time: 308 days on AVERAGE for closed properties. Well, that's downright miserable. What gives? How can this be? Than I figured it out.


Let's take a gander (that right, I said gander), at the Average Sold Price. $827K. Yikes! Well, if all you've got in town is houses around a Million, even in this market it's going to take some time to find buyers. And the actives were even HIGHER, averaging well over a million.


So what does that mean? Well, buyers should probably take a look at most asking prices and realize that they are more, uh, "suggestive" than firm. After all, a great many folks have been out there for 6 months or more, and sellers get antsy after that 150 day mark. And sellers: might want to think about some price reductions if you're 1M plus. There's not enough buyers to go around at that level, and that's why you're not getting sold. As a final note, if your bargain hunting in Sherborn - under 800K - the market is quite different, as demand remains quite strong. We saw a similar break down in Sudbury a while ago, where demand under 800 was totally different than above 800, and we see the same here.


Sherborn Houses For Sale and Sold Market Statistics - Raw MLS Data

Sellers above 1M should be sharpening their

pencils - ans asking prices - in Sherborn


  • There are 35 homes listed as For Sale in Sherborn.
  • There have been 22 houses sold in the last 6 months, and 15 homes sold in the last 3 months.
  • The Average number of Days on Market was 308 days for just SOLD homes.
  • There is an Average Market Time of 199 days of the homes For Sale (currently for sale).
  • The amount that was paid in Dollars per Square Foot averaged $249
  • There was an Average Sold Price of $827,488 for sold homes.
  • Sherborn has 0 properties advertised as lender owned/foreclosure (typically foreclosure) .
  • Sherborn has 0 properties advertised as a short-sale is going to be needed by lender .
  • Sherborn “Home Seller Index” (HSI):66 Last Report: N/A


Would you like to see your town profiled on the blog? All you need to do is ask.

Posted in Massachusetts
March 1, 2013

Medfield, MA - Home Sales and Real Estate Market Report (Feb, 2013)

The Medfield Homes For Sale Market Report


The Medfield Home Seller Index has certainly cooled off. Lack of inventory will do that. Medfield checks in at just 46 houses on the market, although, paradoxically, prices have soften a bit in this report too. We may be seeing the top of Medfield market as buyers start to get priced out, and start looking elsewhere for housing. The homes currently for sale is surprisingly high - at 203 days - for a market with so little inventory, that's a bit surprising.


At any rate, it's clear things are a little cooler in Medfield than elsewhere, and so we see the HSI falling from 97 to 85. Hardly a buyers market, but I would expect the current batch of sellers to be interested in talking to buyers who make offers.


Find Your Next Home or Check out the Competition! 


No foreclosures, no short-sales, which is probably the first time a decent sized town has thrown up a double zero for bank owned inventory. I'm happy to see that, but it does mean that the rest of the sellers are probably a little more willing to wait for their price than a bank would.


Medfield Houses For Sale and Sold Market Statistics - Raw MLS Data

door knocker lion

There are fewer doors to knock

on in Medfield for Home Buyers


  • There are 46 homes listed as For Sale in Medfield .
  • There have been 59 houses sold in the last 6 months, and 34 homes sold in the last 3 months.
  • The Average number of Days on Market was 125 days for just SOLD homes.
  • There is an Average Market Time of 203 days of the homes For Sale (currently for sale).
  • The amount that was paid in Dollars per Square Foot averaged $227 (vs. $233 )
  • There was an Average Sold Price of $586,199 for sold homes.
  • Medfield has 0 properties advertised as lender owned/foreclosure (typically foreclosure) .
  • Medfield has 0 properties (vs. 2 in the last report) advertised as a short-sale is going to be needed by lender .
  • Medfield “Home Seller Index” (HSI):97 Last Report: 85


*All statistics are for Single Family Houses and based on data in MLS.


Our Most Requested Posts

About Matt Heisler

Matt Heisler is a real-estate professional and owner of this website. He has been selling homes in MA for buyers and sellers for over 20 years. He is an expert in foreclosure purchases, short-sale purchases, short-sale sales, buy and hold investing, fix and flip investing, and of course traditional residential home sales. He is happy to take questions as they pertain to real estate on Title V, Radon, Termites, Sump Pumps, Roofs, Foundations, Wells, Septic Systems, Cash-Flow, Staging, and a host of other housing issues. As a Vanderbilt University alumnus, he is proud to serve his local community.

Do Good Things Today! Matt Heisler

*All information is posted in good faith and is assumed to be reliable, but may rely on third party information sources.

Posted in Medfield, MA
Feb. 28, 2013

Marlborough, MA - Home Sales and Real Estate Market Report (Feb, 2013)

The Marlborough Homes For Sale Market Report

I can't help but point this out in the chart. Look at the green line here, which tracks the number of homes that are for sale. Looks like the stock market in 2009, right? Well, when that line goes down, prices - and buyer activity - go up. That's what I track with the red line, and you can see that last year, our HSI


was down to a fairly middle of the road 72. Blah. But this report we check in with a scorching 102, probably a best for Marlborough. Can't last though, as inventory levels have dropped so low that without any new houses,

this number is bound to cool off - just as we've seen in a number of towns in the last few reports.


So why the sudden uptick in Marlborough? Well with prices rising in other towns - and Marlborough about the same as it was last year- it's looking like a bargain right now (and it is, frankly). Buyers are pretty smart, and when they see bargains, they move in, until prices adjust. They haven't -yet - but I would expect a jump in Marlborough prices by the end of the year, based on what we're seeing.


So potential home sellers! Get out there and ask about what the market might do for you this year - the message could be positive. Home Buyers: Marlborough is still a value, but it may not stay that way for long, so don't wait around.


Marlborough Houses For Sale and Sold Market Statistics - Raw MLS Data


Pink House

Even Pink Houses are Selling right Now in Marlborough

  • There are 77 homes listed as For Sale in Marlborough .
  • There have been 139 houses sold in the last 6 months, and 76 homes sold in the last 3 months.
  • The Average number of Days on Market was 106 days for just SOLD homes.
  • There is an Average Market Time of 189 days of the homes For Sale (currently for sale).
  • The amount that was paid in Dollars per Square Foot averaged $152 (vs. $157 )
  • There was an Average Sold Price of $280,346 for sold homes.
  • Marlborough has 3 properties (vs. 9 in the last Marlborough report) advertised as lender owned/foreclosure (typically foreclosure) .
  • Marlborough has 9 properties (vs. 11) advertised as a short-sale is going to be needed by lender .
  • Marlborough “Home Seller Index” (HSI): 102 Last Report: 92


*All statistics are for Single Family Houses and based on data in MLS.


Our Most Requested Posts

About Matt Heisler

Matt Heisler is a real-estate professional and owner of this website. He has been selling homes in MA for buyers and sellers for over 20 years. He is an expert in foreclosure purchases, short-sale purchases, short-sale sales, buy and hold investing, fix and flip investing, and of course traditional residential home sales. He is happy to take questions as they pertain to real estate on Title V, Radon, Termites, Sump Pumps, Roofs, Foundations, Wells, Septic Systems, Cash-Flow, Staging, and a host of other housing issues. As a Vanderbilt University alumnus, he is proud to serve his local community.

Do Good Things Today! Matt Heisler

*All information is posted in good faith and is assumed to be reliable, but may rely on third party information sources.

Posted in Marlborough, MA
Feb. 27, 2013

Hudson, MA - Home Sales and Real Estate Market Report (Feb, 2013)

The Hudson, MA Homes For Sale Market Report

A very typical report from what we've been seeing. No real pull back in prices, but the number of homes for sale is a very tight. There's a huge number of pending in this report, unlike last February, so we're going to see some eye popping numbers I bet in the next report. However, the pendings haven't hit the data set yet, so it looks like the market has softened. But it really hasn't.


No foreclosures in Hudson this report, which is pretty amazing. Short-sale are up, continuing to demonstrate that banks are willing to deal with

Find Your Next Home or Check out the Competition!

these events, and the market is supplying them with options to do it. It's not for everyone, but if you need to, it's way better than foreclosure, for a bunch of reasons.


Hudson, MA Houses For Sale and Sold Market Statistics - Raw MLS Data


  • There are 53 homes listed as For Sale in Hudson, MA.
  • There have been 77 houses sold in the last 6 months, and 30 homes sold in the last 3 months.
  • The Average number of Days on Market was 126 days for just SOLD homes.
  • There is an Average Market Time of 161 days of the homes For Sale (currently for sale).
  • The amount that was paid in Dollars per Square Foot averaged $165 (vs. $167 )
  • There was an Average Sold Price of $289,156 for sold homes.
  • Hudson, MA has 0 properties (vs. 2 in the last report) advertised as lender owned/foreclosure (typically foreclosure) .
  • Hudson, MA has 7 properties (vs. 5) advertised as a short-sale is going to be needed by lender .
  • Hudson, MA “Home Seller Index” (HSI):85  Last Report:95 

Our Most Requested Posts

About Matt Heisler

Matt Heisler is a real-estate professional and owner of this website. He has been selling homes in MA for buyers and sellers for over 20 years. He is an expert in foreclosure purchases, short-sale purchases, short-sale sales, buy and hold investing, fix and flip investing, and of course traditional residential home sales. He is happy to take questions as they pertain to real estate on Title V, Radon, Termites, Sump Pumps, Roofs, Foundations, Wells, Septic Systems, Cash-Flow, Staging, and a host of other housing issues. As a Vanderbilt University alumnus, he is proud to serve his local community.

Do Good Things Today! Matt Heisler

*All information is posted in good faith and is assumed to be reliable, but may rely on third party information sources.

Posted in Hudson, MA
Feb. 20, 2013

Red Sox Lineup and Injury Projections:2013

Pedro is At Spring Training for BoSox-Are the Staff's problems solved?

Like many fans, when Pedro showed up in camp, and then did his first press conference, I drank in all I could get. I watched the video, read three different beat writers breakdowns, and marveled that Pedro could be just as captivating as ever.


Of course, I also started reading some stuff that even I, a Pedro acolyte, made me just a bit, mmm, incredulous. Chad Finn, amoung others, seemed certain that the Sox pitching staff could benefit significantly from Pedro. That he'll be the savior to straightening out those native Spanish speaking pitchers (and perhaps others!) who are one cultural gap or pitching lesson away from reaching the next level.


Sox, Sox, Sox!!

Uh, no. It's not exactly as if Pedro didn't share his secrets or discuss approaches with other pitchers while he was PLAYING, and I don't remember too many players - once removed from Pedro's team - turning into garbage once the flash of the Oracle was removed from their sight. I'm also pretty sure he was capable of rubbing people the wrong way (Schilling) despite his remarkable gift of gab. Will he help? Of course. Will he drop Dubront's ERA by a run? Highly unlikely.


I'd actually be more excited to see Schilling in this role, and I'll tell you why. Schilling was a talented pitcher who "didn't get it" and really just kinda "got by" for the first section of his his career. But the lightbulb went on for him, and he learned discipline. That's what those notebooks were about.  You remember, the notebooks that Schilling kept on every hitter, every at bat, and every umpire. I'm not saying Pedro didn't have discipline, he did, but Schilling's was the difference between being "that guy" and the dominating ace with the ridiculous playoff success that he had. Of course, I don't remember anyone other pitcher starting to keep notebooks and emulating Schill, and that's the moral of this story: You either want it bad enough, or you don't. No matter who is in your ear, that isn't likely to change.


OK, on to the lineups.


Projected Lineup for Red Sox

Well, it's early, and we have a bunch of changes, but I like seeing how far ahead I can guess these things, so let's go.


Left/Right "Everyday" Line up vs. right handers.


1. L--Ellsbury, CF

2. R--Pedroia, 2B

3. L--Ortiz, DH

4. R--Napoli, 3B

5. S--Saltalmacchia, C

6. R--Middlebrooks, 3B

7. L--Drew, SS

8. R--Gomes, LF

9. S--Victorino, RF


The theory here is that Farrell, like Francona, will opt for right vs. left wherever possible, and protect younger players (Middlebrooks) and newer players (Drew, Gomes, Victorino) by putting them in the bottom of the line up. Yes, I know Salty is a little high here, but you can't bat Drew or Victorino fifth, and bunching Napoli and Middlebrooks isn't ideal. I'm a fan of your best hitter hitting third, so that puts Ortiz in the three spot. This line up is much more balanced than last years - which was weighed down by left handers. I call it the everday line up, but there's going to be no such thing for this team this year, and you need a starting point.


Vs. Lefties:

Once we have everyone settled in, I think we might see this, against left handers. Maybe even sooner than that, if Gomes is ready.


1. L--Ellsbury, CF

2. R--Gomes, LF

3. R--Pedroia, 2B

4. L--Ortiz, DH

5. R--Napoli, 3B

6. S--Saltalmacchia, C

7. R--Middlebrooks, 3B

8. L--Drew, SS

9. S--Victorino, RF


This line up I like better. Gomes kills lefties, and you got nice power 4-7. I'd expect to see it a lot, and it will definitely THUMP.  Lots of runs in this group. Until of course, Napoli is hurt. And Ortiz is hurt. I think both of those are a given. So then we have the post injury line-up:


1. L--Ellsbury, CF

2. S--Victorino, RF

3. R--Pedroia, 2B

4. R--Middlebrooks, 3B

5. S--Saltalmacchia, C

6. R--Gomes, LF

7. L--Mike Carp, 1B

8. Various (DH)

9. L--Drew, SS


Yeah. I know. But we have to be realistic here. Napoli went from a 3 year, 39 million contract to a 5 million contract. Why? He's never going to finish the season. Clearly, nobody believes that. Especially the Sox, who just picked up Mike Carp to make sure they have "extra" depth at 1b. Not an accident folks. And everyone loves big Papi, but despite the slimmed down physique last year still had serious injury issues. Losing him for that type of injury or something similar - or worse- should really be expected at his age. Oh, and a minor note: Drew and Victorino are switchable in 2 and 9, which will depend on match-up and who's hitting better.


A couple of other thoughts: If Gomes struggles against righties, as he has historically, we'll see more of Daniel Nava. If Ellsbury goes down, Victorino moves to center - and that is clearly part of why the Sox locked him up at such big money, because they need him next year in center if Jackie Bradley isn't ready (and he probably won't be). Let's hope Jacoby has a statement year, because these roster moves make me think he's on the way out.


Love to hear your thoughts on how wrong this is!


Posted in Red Sox
Feb. 18, 2013

Hopkinton, MA - Home Sales and Real Estate Market Report (Feb, 2013)

The Hopkinton Homes For Sale Market Report

OK, so you can basically take everything I just said about Holliston real estate, and say it again here. Maybe even a little more, even. Note the yellow line (home sales) below and it's sharp drop. Can't sell what's not available.


There are a couple of things worth noting.  Home Prices/sq foot have moved up very steadily since last year - 5%. Hopkinton I think is moving faster than the other towns (more on that this week perhaps), and soon may be entering the price where buyers start to look at their options. Or, it could function like Natick and keep moving up. Pulte has started a new development in Hopkinton that will be bringing lots of inventory in the mid and lower levels (300-650K) - but I don't think they'll be building many larger houses that are a staple of the Hopkinton market currently. (I can't link to the development because they are not a client, but if you have questions, please e-mail me!). With supply increasing, that may also put the breaks on prices - but not for a while yet I think. There's clearly more demand than supply, that's not going to disappear overnight.


Hopkinton Houses For Sale and Sold Market Statistics - Raw MLS Data

Plow and Snow

Let's dig out.


  • There are 52 homes listed as For Sale in Hopkinton .
  • There have been 108 houses sold in the last 6 months, and 44 homes sold in the last 3 months.
  • The Average number of Days on Market was 106 days for just SOLD homes.
  • There is an Average Market Time of 212 days of the homes For Sale (currently for sale).
  • The amount that was paid in Dollars per Square Foot averaged $191 (vs. $190 in the last report)
  • There was an Average Sold Price of $560,493 for sold homes.
  • Hopkinton has 0 properties (vs. 0) advertised as lender owned/foreclosure (typically foreclosure) .
  • Hopkinton has 2 properties (vs. 2) advertised as a short-sale is going to be needed by lender .
  • Hopkinton “Home Seller Index” (HSI):104 Last Report: 121


*All statistics are for Single Family Houses and based on data in MLS.


Our Most Requested Posts

About Matt Heisler

Matt Heisler is a real-estate professional and owner of this website. He has been selling homes in MA for buyers and sellers for over 20 years. He is an expert in foreclosure purchases, short-sale purchases, short-sale sales, buy and hold investing, fix and flip investing, and of course traditional residential home sales. He is happy to take questions as they pertain to real estate on Title V, Radon, Termites, Sump Pumps, Roofs, Foundations, Wells, Septic Systems, Cash-Flow, Staging, and a host of other housing issues. As a Vanderbilt University alumnus, he is proud to serve his local community.

Do Good Things Today! Matt Heisler

*All information is posted in good faith and is assumed to be reliable, but may rely on third party information sources.

Posted in Hopkinton MA
Feb. 17, 2013

Holliston, MA - Home Sales and Real Estate Market Report (Feb, 2013)


The Holliston Homes For Sale Market Report

The Holliston HSI has gone down a smidge - still scortching at 122 - but that's going to happen when you run out of houses. With less than 36 houses on the market (a number are already pending sales), the rate of sales has to fall, peaking from 133 in the last report. You can't sell 133 houses if there aren't 133 houses to sell!


In the past, we've seen Holliston be a bit of a laggard in the spring, but with inventory so thin, buyers are expanding the towns they are looking at. I just bumped in to someone who is looking at Northborough, Ashland and Holliston. That's a wide spectrum, but buyers are needing to do that in this market looking for options.


Holliston is only down a little bit from where it was last year though - giving hope that more inventory may be coming to this town soon. School vacation week means many buyers will be on holiday - which means it's a great time to make an offer!!


Holliston Houses For Sale and Sold Market Statistics - Raw MLS Data

More Snow Today - Didn't stop traffic at my

Open House though.  Busy, busy!!


  • There are 36 homes listed as For Sale in Holliston.
  • There have been 93 houses sold in the last 6 months, and 35 homes sold in the last 3 months.
  • The Average number of Days on Market was 94 days for just SOLD homes.
  • There is an Average Market Time of 152 days of the homes For Sale (currently for sale).
  • The amount that was paid in Dollars per Square Foot averaged $183 (vs. $184 in the last report )
  • There was an Average Sold Price of $395,859 for sold homes.
  • Holliston “Home Seller Index” (HSI):122 Last Report: 134


*All statistics are for Single Family Houses and based on data in MLS.


Our Most Requested Posts

About Matt Heisler

Matt Heisler is a real-estate professional and owner of this website. He has been selling homes in MA for buyers and sellers for over 20 years. He is an expert in foreclosure purchases, short-sale purchases, short-sale sales, buy and hold investing, fix and flip investing, and of course traditional residential home sales. He is happy to take questions as they pertain to real estate on Title V, Radon, Termites, Sump Pumps, Roofs, Foundations, Wells, Septic Systems, Cash-Flow, Staging, and a host of other housing issues. As a Vanderbilt University alumnus, he is proud to serve his local community.

Do Good Things Today! Matt Heisler

*All information is posted in good faith and is assumed to be reliable, but may rely on third party information sources.

Posted in Holliston, MA
Feb. 10, 2013

Grafton, MA - Home Sales and Real Estate Market Report (Feb, 2013)

The Grafton, MA Homes For Sale Market Report


Grafton continues on in our disappearing house inventory trend. This is another burb to the West, but even here we're seeing a solid tightening. The only thing that points to a softer market is the larger days on market, but that's being inflated by the new construction numbers, which Grafton has quite a few homes active, where many of the towns have limited new construction.


$/per square foot held steady from the last report, but with active houses for sale falling sharply, and sales still outpacing the new home inventory, there will be pressure on home prices to rise this spring in Grafton.


The HSI moved down a little bit, showing that Grafton remains a balanced market, but

Find Your Next Home or Check out the Competition!

buyers should look their sooner, rather than later, as it may not stay that way. Also worth noting is the sharp reduction in bank inventory, another positive sign as buyers in Grafton are taking on more risk, and banks start to exit the market.


Grafton, MA Houses For Sale and Sold Market Statistics - Raw MLS Data

Snowy Road

Saw a lot this yesterday!


  • There are 84 homes listed as For Sale in Grafton, MA .
  • There have been 97 houses sold in the last 6 months, and 46 homes sold in the last 3 months.
  • The Average number of Days on Market was 109 days for just SOLD homes.
  • There is an Average Market Time of 298 days of the homes For Sale (currently for sale).
  • The amount that was paid in Dollars per Square Foot averaged $168 (vs. $168)
  • There was an Average Sold Price of $385,236 for sold homes.
  • Grafton, MA has 1 properties (vs. 3 in the last report) advertised as lender owned/foreclosure (typically foreclosure) .
  • Grafton, MA has 4 properties (vs. 7) advertised as a short-sale is going to be needed by lender .
  • Grafton, MA “Home Seller Index” (HSI)79: Last Report:85


Our Most Requested Posts

About Matt Heisler

Matt Heisler is a real-estate professional and owner of this website. He has been selling homes in MA for buyers and sellers for over 20 years. He is an expert in foreclosure purchases, short-sale purchases, short-sale sales, buy and hold investing, fix and flip investing, and of course traditional residential home sales. He is happy to take questions as they pertain to real estate on Title V, Radon, Termites, Sump Pumps, Roofs, Foundations, Wells, Septic Systems, Cash-Flow, Staging, and a host of other housing issues. As a Vanderbilt University alumnus, he is proud to serve his local community.

Do Good Things Today! Matt Heisler

*All information is posted in good faith and is assumed to be reliable, but may rely on third party information sources.

Posted in Grafton, MA