General Index 

General House Hunting Articles

Things about Housing Everyone Should Know

Good Towns for Buyers, Good Towns for Sellers

Home Buying, Step by Step

Common Housing Problems and What to Do

Financing

Common Expenses when Buying or Selling Homes

After You Move In

Remodeling Slideshows for Kitchens, Baths, and others!

Newsletters

Dec. 7, 2013

Southborough, MA - Home Sales and Real Estate Market Report (December, 2013)

Homes For Sale in Southborough Market Report

In Southborough, we see a trend that I think will hold till the end of January. Tight inventories of homes for sale leading to reduce transaction numbers - and lower HSIs. The HSI (Home Selling Index) is my indicator to show how much demand there is for housing in a given market. Here's the chart.

Can’t see the chart? You can find it Here .

Yes, the HSI has fallen. But don't be fooled. The detailed data below shows home prices are still on the rise. The indicator fell because the number of transactions has slowed, but that's pretty typical this time of year, and it's not helped by the fact that there's only 35 houses for sale, matching the last reports record low. Southborough should normally have double that this time of year.  The fact that home prices are still rising sharply shows demand has not abated in Southborough


Really, this shouldn't be much of a surprise, as we've seen demand pick up just over the line in Middlesex county, where prices have moved up sharply. Southborough is now following this trend.


Southborough Houses For Sale and Sold Market Statistics - Raw MLS Data


  • Southborough “Home Seller Index” (HSI): 127 Last Report:143
  • There are 35 homes listed as For Sale in Southborough.

    First Snow of the Year last night.  Perhaps

    the weather will deter home buyers in Southborough.

  • There have been 85 houses sold in the last 6 months, and 36 homes sold in the last 3 months.
  • The Average number of Days on Market was 73 days for just SOLD homes.
  • There is an Average Market Time of 125 days of the homes For Sale (currently for sale).
  • The amount that was paid in Dollars per Square Foot averaged $217 (vs. $207 )
  • There was an Average Sold Price of $629,611 for sold homes.
  • Southborough, MA, has 0 properties (vs. 0 in the last report) advertised as lender owned/foreclosure (typically foreclosure) .
  • Southborough has 1 properties (vs. 0) advertised as a short-sale is going to be needed by lender.


Follow Matt's board Southborough-Real-Estate on Pinterest.


*All statistics are for Single Family Houses and based on data in MLS. Matt’s HSI is proprietary. (That means you won’t find it anywhere else. Take that, Case-Schilling!).

More Great Reads!

About Matt Heisler

Matt Heisler is a real-estate professional and owner of this website. He has been selling homes in MA for buyers and sellers for over 20 years. He is an expert in foreclosure purchases, short-sale purchases, short-sale sales, buy and hold investing, fix and flip investing, and of course traditional residential home sales. He is happy to take questions as they pertain to real estate on Title V, Radon, Termites, Sump Pumps, Roofs, Foundations, Wells, Septic Systems, Cash-Flow, Staging, and a host of other housing issues. As a Vanderbilt University alumnus, he is proud to serve his local community.

Do Good Things Today! Matt Heisler

*All information is posted in good faith and is assumed to be reliable, but may rely on third party information sources.
Posted in Southborough, MA
Dec. 6, 2013

Yankees get Outbid for Cano - How it Helps and Hurts the Sox

No, the lead isn't Jacoby Ellsbury

That's right Sox fans. I already bid adieu to Ellsbury in the last post, so there's no need to dwell on it other than to arch an eyebrow at the destination. So now that Cano moves to the West coast, we can review the two moves in tandem, and see how they are related.


Even the Yankees don't have 20 million+ for everybody

Most observers - until recently - have felt the Yankees were committed to the getting under the luxury tax threshold. When they signed Ellsbury, it was seen as a sign that they were going to go over anyway. But the press read the tea leaves wrong: It meant they knew the bidding had gotten too rich for Cano. The money and the years on both contracts is pretty silly, but the fun debate will be which contract is more of an albatross? No one will know for at least 3 or 4 years- both these players are really good and will have fine seasons for at least that long - but Seattle is paying 20+ million for Cano when he is 41. No way the back end of that contract looks good. The only comparable contract might be A-rods. I do get Seattle's point though: with a legitimate center of the diamond, middle of the order hitter, they can attract the rest of the pieces they need and build a winner in the West. Guess we'll see if they can do that.


Anyway, Cano was gone as soon as Ellsbury inked that deal, and that was that.


So the Yankees are worse off, right?

Not necessarily. If they had signed Cano, they would have little money for all of their other holes - third base (whether or not A-rod plays), second base, and first base is probably a problem, and pitching. The Yankees need a lot of pitching, that most desperate commodity, and it's not clear to me they have the money left to go get enough. They DEFINTITELY would have been strapped with a Cano signing, although it would have plugged a hole. The Yankees have to replace Hughes (won't be that hard), Pettite (hard), Kuroda (probably with Kuroda, but he's 39 I think), and Rivera (good luck with that). They've got 40-55 million I guess to do that, but when you're talking starting pitching, that doesn't go very far. Kuroda will be 14 million of that.


Even if they plug all those holes and stay under the threshold, they are going to be thin, thin, thin. A couple of injuries to the older guys should be expected - and will be problematic. Jeter, Texeria, Ellsbury (yeah, he's hurt a lot, maybe you've heard), A-rod (who'll be suspended anyway). But thin is better than "with holes" and that's how they would have ended up with Cano on the team. Guess they figured that out, so Sayonara Cano!


Not having to face Cano will be nice for the Sox, although he didn't really KILL them at the plate- just a .784 OPS over the past 3 years. Now though, they'll be able to focus on the next biggest threat (That's you Ellsbury!).


Other Moves of Note

I think the Yanks addressed a need of huge proprtions by getting McCann. For the Sox, I think drawing the line with Salty tells you two things - they have huge confidence that one of their three prospects will turn to gold (C'mon Lavarnway!), and that he wasn't as "irrelplaceable" as you'd like to think. I liked his power, but the strikeouts were brutal. He couldn't stop the opponents from stealing, and I still think there were a lot of questions about his game calling. So you had an average catcher with better than average power numbers. Clearly, that's not someone you need to tie yourself to for three years - so they didn't.


The most exciting moves are yet to come though. The Sox have a mess of trade chips, and with the winter meetings they are going to be very active, I think. The sox don't really NEED to do anything - they have six starters under contract, a closer, and all the positions on the diamond (accept first)- but deals now are usually cheaper than in July, so we'll see what happens. Myself, I'd like to see both Bradley and Boegarts on the team next year. I've seen enough of Boegarts, he's going to hit and hit for power, and Bradley has a lot of upside, with .370 OBP in his last 500 AB's at AA and AAA. He can contribute, for sure. It'll come down to how worried Cherrington is about managing the 40 man roster - he has too many good players, a nice problem to have - and may feel the need to do a deal in order to make sure no one gets exposed.


Stay posted!

Posted in Red Sox
Nov. 29, 2013

Shrewsbury, MA - Home Sales and Real Estate Market Report (November, 2013)

Homes For Sale in Shrewsbury Market Report

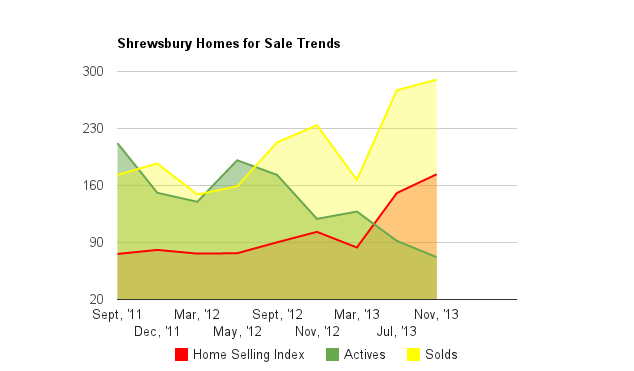
Shrewsbury continues to see home buyers keep the pressure on. With home inventories falling, prices are moving up, and that's all in this report. As noted elsewhere, you can't often have a HSI above 140 without rising home values, and we've been above that level for two reports, and prices have moved accordingly.


Shrewsbury Homes On the Market Continue to Shrink,

 pushing up home prices and the risk buyers are taking on.

Can’t see the chart? You can find it Here .


Everything else looks much like the other reports this quarter. It is probably worth noting though that Shrewsbury set a record in this one for the fewest days on market for sold properties- showing buyers are moving quicker than ever since we started tracking it here on the blog. That a lot of motivation for a good sized town.


Shrewsbury Houses For Sale and Sold Market Statistics - Raw MLS Data


  • Shrewsbury “Home Seller Index” (HSI):174 Last Report:151
  • There are 72 homes listed as For Sale in Shrewsbury.

    Home Buyers haven't aren't leaving leftovers in the Shrewsbury

    Real Estate Market.  And yes, that is the third

    Thanksgiving joke in a row. 

  • There have been 290 houses sold in the last 6 months, and 153 homes sold in the last 3 months.
  • The Average number of Days on Market was 76 days for just SOLD homes.
  • There is an Average Market Time of 150 days of the homes For Sale (currently for sale).
  • The amount that was paid in Dollars per Square Foot averaged $186 (vs. $177 )
  • There was an Average Sold Price of $435,882 for sold homes.
  • Shrewsbury, MA, has 2 properties (vs. zero in the last Shrewsbury report) advertised as lender owned/foreclosure (typically foreclosure) .
  • Shrewsbury has 2 properties advertised as a short-sale is going to be needed by lender.


*All statistics are for Single Family Houses and based on data in MLS. Matt’s HSI is proprietary. (That means you won’t find it anywhere else. Take that, Case-Schilling!).

More Great Reads!

About Matt Heisler

Matt Heisler is a real-estate professional and owner of this website. He has been selling homes in MA for buyers and sellers for over 20 years. He is an expert in foreclosure purchases, short-sale purchases, short-sale sales, buy and hold investing, fix and flip investing, and of course traditional residential home sales. He is happy to take questions as they pertain to real estate on Title V, Radon, Termites, Sump Pumps, Roofs, Foundations, Wells, Septic Systems, Cash-Flow, Staging, and a host of other housing issues. As a Vanderbilt University alumnus, he is proud to serve his local community.

Do Good Things Today! Matt Heisler

*All information is posted in good faith and is assumed to be reliable, but may rely on third party information sources.

Posted in Shrewsbury MA
Nov. 28, 2013

Northborough, MA - Home Sales and Real Estate Market Report (November, 2013)

Homes For Sale in Northborough Market Report

Well it's about time! Looks like home buyers have finally figured out Northborough was a good deal. Next time, check the blog, it was out here all spring. Save yourself some time next time!! Here's what I mean:

Can’t see the chart? You can find it Here .


What we see here (and in the data below), is that the HSI streaked up to a pretty outstanding 166, as buyers grabbed everything in Northborough. And why shouldn't they have? There was lots of good stuff sitting around, at almost last years prices.

Since they all came in at once though, they bumped into each other, and pushed prices up almost 10% in one report. Not sure those will hold, but the number of homes for sale is at an all time low right now, so they will hold for now.


I'll never figure out why Northborough is always the late summer market, but it certainly has been that way for a couple of years. As Bruce Willis said in Die Hard, "Welcome to the party, pal!"


Northborough Houses For Sale and Sold Market Statistics - Raw MLS Data


  • Northborough “Home Seller Index” (HSI):120 Last Report: 166
  • There are 33 homes listed as For Sale in Northborough.

    Home Buyers Gobbled Up Homes in

    Northborough, MA in this report.

  • There have been 124 houses sold in the last 6 months, and 64 homes sold in the last 3 months.
  • The Average number of Days on Market was 76 days for just SOLD homes.
  • There is an Average Market Time of 149 days of the homes For Sale (currently for sale).
  • The amount that was paid in Dollars per Square Foot averaged $195 (vs. $177 )
  • There was an Average Sold Price of $414,949 for sold homes.
  • Northborough, MA, has 1 properties (vs. 1 in the last Northborough report) advertised as lender owned/foreclosure (typically foreclosure) .
  • Northborough has 1 properties advertised as a short-sale is going to be needed by lender.


*All statistics are for Single Family Houses and based on data in MLS. Matt’s HSI is proprietary. (That means you won’t find it anywhere else. Take that, Case-Schilling!).

More Great Reads!

About Matt Heisler

Matt Heisler is a real-estate professional and owner of this website. He has been selling homes in MA for buyers and sellers for over 20 years. He is an expert in foreclosure purchases, short-sale purchases, short-sale sales, buy and hold investing, fix and flip investing, and of course traditional residential home sales. He is happy to take questions as they pertain to real estate on Title V, Radon, Termites, Sump Pumps, Roofs, Foundations, Wells, Septic Systems, Cash-Flow, Staging, and a host of other housing issues. As a Vanderbilt University alumnus, he is proud to serve his local community.

Do Good Things Today! Matt Heisler

*All information is posted in good faith and is assumed to be reliable, but may rely on third party information sources.

Posted in Northborough, MA
Nov. 27, 2013

Northbridge, MA - Home Sales and Real Estate Market Report (November, 2013)

Homes For Sale in Northbridge Market Report

Well, we have some interesting elements in Northbridge. A sign of things to come or no? Let's see what we've got....


Can’t see the chart? You can find it Here .


Let's start with the big news - we see the HSI FALLING significantly in Northbridge. See that red line make a quick turn in the downward direction? Try to find that elsewhere on the blog. You won't. Why is that the case? Well we have the number of homes for sale up (the green line), and the number of homes that sold stalled, and fell a bit.

However, that's not the whole story. Northbridge is really the only town in Metrowest that I track has has a significant amount of new construction. Hopkinton does too- but much of it is not advertised by Pulte, and therefore doesn't go into the stats. Northbridge's new construction is probably underweight as well, but it still makes up about 30% of the listed inventory, so it has a big impact. How's all the new construction doing? Well, there's one number I track that tells us that: The active days on market.


The active days on market, which because of all the new construction, has floated between 260 days and 300 days, fell to 124, as many of the construction opportunities sold out, and their properties fell out of MLS. People are flocking to Northbridge for new construction (relatively affordable new construction). As such, the market is doing quite well, but the HSI is going to look softer because of the extra supply, much of which has recently come on the market (so we'll see DOM climb from here).


It's kept a lid on prices too - $154/ sq foot is the same as the last report, and things have barely moved compared to other towns.


Northbridge Houses For Sale and Sold Market Statistics - Raw MLS Data


  • Northbridge “Home Seller Index” (HSI):88 Last Report: 102
  • There are 79 homes listed as For Sale in Northbridge.
  • There have been 107 houses sold in the last 6 months, and 50 homes sold in the last 3 months.

    Don't be a Turkey.  Get the facts about your market

    from my Blog!

  • The Average number of Days on Market was 118 days for just SOLD homes.
  • There is an Average Market Time of 124 days of the homes For Sale (currently for sale).
  • The amount that was paid in Dollars per Square Foot averaged $154 (vs. $154)
  • There was an Average Sold Price of $310,794 for sold homes.
  • Northbridge ,MA, has 1 properties (vs. 3 in the last report) advertised as lender owned/foreclosure (typically foreclosure) .
  • Northbridge has 4 properties advertised as a short-sale is going to be needed by lender.


*All statistics are for Single Family Houses and based on data in MLS. Matt’s HSI is proprietary. (That means you won’t find it anywhere else. Take that, Case-Schilling!).


More Great Reads!

About Matt Heisler

Matt Heisler is a real-estate professional and owner of this website. He has been selling homes in MA for buyers and sellers for over 20 years. He is an expert in foreclosure purchases, short-sale purchases, short-sale sales, buy and hold investing, fix and flip investing, and of course traditional residential home sales. He is happy to take questions as they pertain to real estate on Title V, Radon, Termites, Sump Pumps, Roofs, Foundations, Wells, Septic Systems, Cash-Flow, Staging, and a host of other housing issues. As a Vanderbilt University alumnus, he is proud to serve his local community.

Do Good Things Today! Matt Heisler

*All information is posted in good faith and is assumed to be reliable, but may rely on third party information sources.

Posted in Northbridge MA
Nov. 18, 2013

Natick, MA - Home Sales and Real Estate Market Report (November, 2013)

Homes For Sale in Natick Market Report


*****BUBBLE ALERT*******

This is a bubble alert, brought to you because I always get asked about prices and when the next bubble will be. Now we already know in the last report I mentioned the market in Natick was looking a little, ahem, insane, and prices were too damn low. But really, now we've gone beyond that. Buyers should be extremely careful about the risk they are taking on in this market, and home sellers in Natick need to seriously get out there and put a sign on their lawn. The HSI is at 284. That number is so high, I can't really tell you what the heck it means. It means prices are going up though. Further increases are going to happen. They are happening right now. With this kind of demand, the market will have significant pockets of irrationality.


Now just because it's a bubble, that doesn't mean I think it's going to "Pop".  I do think prices are going to keep going up.  However, with so little on the market, buyers "internal pricing mechanism" of what is worth the price is not going to be reliable.  There will be situation where buyers will pay 5-10% more than the rational price, just to be successful in a bid war.  That means prices will need to go up 5-10%, just to get them back to even.  That's not a good place to be with a leveraged investment.


This ends the bubble alert in Natick, MA.  You've been warned!

*****BUBBLE ALERT*******


Can’t see the chart? You can find it Here .

We do see a big jump in prices in Natick in this report - over $12 a square foot, or about 5%. Not bad for 3 months. Yes, it's about 18% a year. With Wellesley at $400/sq foot, I guess buyers are thinking Natick still looks cheap. I'm not so convinced - but if I was a builder I'd be doing tear downs in Natick (some are already!).

How crazy is this? Well, I figure that Natick needs about another 50 houses - more than doubling the market - of homes for sale for the market to go to a situation where prices would stabilize. Chances of that happening? Well, they are not good. The houses that haven't sold are listed at $285/ sq foot. I think prices are headed there - and soon. Tough market for home buyers!! Good LUCK!


Natick Houses For Sale and Sold Market Statistics - Raw MLS Data


  • Natick “Home Seller Index” (HSI):284 Last Report: 202
  • There are 40 homes listed as For Sale in Natick.
  • There have been 292 houses sold in the last 6 months, and 154 homes sold in the last 3 months.
  • The Average number of Days on Market was 50 days for just SOLD homes.
  • There is an Average Market Time of 104 days of the homes For Sale (currently for sale).
  • The amount that was paid in Dollars per Square Foot averaged $262 (vs. $250 )
  • There was an Average Sold Price of $550,756 for sold homes.
  • Natick, MA, has 0 properties (vs. 0 in the last report) advertised as lender owned/foreclosure (typically foreclosure) .
  • Natick has 0 properties advertised as a short-sale is going to be needed by lender.


*All statistics are for Single Family Houses and based on data in MLS. Matt’s HSI is proprietary. (That means you won’t find it anywhere else. Take that, Case-Schilling!).

More Great Reads!

About Matt Heisler

Matt Heisler is a real-estate professional and owner of this website. He has been selling homes in MA for buyers and sellers for over 20 years. He is an expert in foreclosure purchases, short-sale purchases, short-sale sales, buy and hold investing, fix and flip investing, and of course traditional residential home sales. He is happy to take questions as they pertain to real estate on Title V, Radon, Termites, Sump Pumps, Roofs, Foundations, Wells, Septic Systems, Cash-Flow, Staging, and a host of other housing issues. As a Vanderbilt University alumnus, he is proud to serve his local community.

Do Good Things Today! Matt Heisler

*All information is posted in good faith and is assumed to be reliable, but may rely on third party information sources.

Posted in Natick, MA
Nov. 17, 2013

Millis, MA - Home Sales and Real Estate Market Report (November, 2013)

Homes For Sale in Millis Market Report


Millis remains strong, showing a back-to-back record for the HSI, as it hit 180.


Where we've seen these levels, we've seen rising prices - and Millis is no exception. Prices have hit $197 a square foot, up 17% in a year, and well over 20% in 18 months.


Can’t see the chart? You can find it Here .


I always caution it's a small town, with a small data set, but we've seen other towns with similar numbers. Still: 59 Days on Market for sold homes is really, really, low. And if you want to lookin in Millis, good luck - there's only 14 homes on the market. That means lots of price ranges have one or house or no houses at all, so you'll be waiting around a while for a Millis address.

Find Your Next Home or Check out the Competition!

Only one short-sale in Millis, not much to talk about there. Buyers should certainly consider looking at other towns - the wait and competition could make for a long search in Millis. Home sellers should take advantage of the current imbalance - in a small town it can disappears as fast as it appears.

Millis Houses For Sale and Sold Market Statistics - Raw MLS Data


  • Millis “Home Seller Index” (HSI):180 Last Report:174
  • There are 14 homes listed as For Sale in Millis.

    Leaves may be falling, but home prices are not.

  • There have been 53 houses sold in the last 6 months, and 31 homes sold in the last 3 months.
  • The Average number of Days on Market was 59 days for just SOLD homes.
  • There is an Average Market Time of 102 days of the homes For Sale (currently for sale).
  • The amount that was paid in Dollars per Square Foot averaged $191 (vs. $197 )
  • There was an Average Sold Price of $384,073 for sold homes.
  • Millis ,MA, has 0 properties (vs. 0 in the last report) advertised as lender owned/foreclosure (typically foreclosure) .
  • Millis has 1 properties (vs. 0) advertised as a short-sale is going to be needed by lender.


*All statistics are for Single Family Houses and based on data in MLS. Matt’s HSI is proprietary. (That means you won’t find it anywhere else. Take that, Case-Schilling!).

More Great Reads!

About Matt Heisler

Matt Heisler is a real-estate professional and owner of this website. He has been selling homes in MA for buyers and sellers for over 20 years. He is an expert in foreclosure purchases, short-sale purchases, short-sale sales, buy and hold investing, fix and flip investing, and of course traditional residential home sales. He is happy to take questions as they pertain to real estate on Title V, Radon, Termites, Sump Pumps, Roofs, Foundations, Wells, Septic Systems, Cash-Flow, Staging, and a host of other housing issues. As a Vanderbilt University alumnus, he is proud to serve his local community.

Do Good Things Today! Matt Heisler

*All information is posted in good faith and is assumed to be reliable, but may rely on third party information sources.

Posted in Millis, MA
Nov. 15, 2013

Milford, MA - Home Sales and Real Estate Market Report (November, 2013)

Homes For Sale in Milford Market Report

Milford Continues to climb, as the the HSI approaches 140. Not quite there yet. Do we see rising prices? Yes we do. But not a sharp a rise as we've seen in other towns.


Home Sales hit a record by breaking through 150

sales in the last six months.  Homes for Sale

Inventory remains near the low point.


Can’t see the chart? You can find it Here .

Prices rising more slowly means that Milford remains a good value, and I expect inventory to remain tight until prices rise enough to level things off. No sign that's happening yet.


Find Your Next Home or Check out the Competition!

We also see a dramatic increase in the number of short-sales. This is a pattern we saw in a lot of towns a year ago, as agents realized that the bank's appetite for these transactions had markedly increased. This could just be a flaky data point, but it's worth noting. No foreclosures currently available in Milford.


Milford Houses For Sale and Sold Market Statistics - Raw MLS Data


Milford, MA fire department downtown.


  • There have been 165 houses sold in the last 6 months, and 96 homes sold in the last 3 months.
  • The Average number of Days on Market was 82 days for just SOLD homes.
  • There is an Average Market Time of 102 days of the homes For Sale (currently for sale).
  • The amount that was paid in Dollars per Square Foot averaged $150 (vs. $148 )
  • There was an Average Sold Price of $280,379 for sold homes.
  • Milford, MA, has 0 properties (vs. 1 in the last report) advertised as lender owned/foreclosure (typically foreclosure) .
  • Milford has 7 properties  (vs. 3) advertised as a short-sale is going to be needed by lender.


*All statistics are for Single Family Houses and based on data in MLS. Matt’s HSI is proprietary.

More Great Reads!

About Matt Heisler

Matt Heisler is a real-estate professional and owner of this website. He has been selling homes in MA for buyers and sellers for over 20 years. He is an expert in foreclosure purchases, short-sale purchases, short-sale sales, buy and hold investing, fix and flip investing, and of course traditional residential home sales. He is happy to take questions as they pertain to real estate on Title V, Radon, Termites, Sump Pumps, Roofs, Foundations, Wells, Septic Systems, Cash-Flow, Staging, and a host of other housing issues. As a Vanderbilt University alumnus, he is proud to serve his local community.

Do Good Things Today! Matt Heisler

*All information is posted in good faith and is assumed to be reliable, but may rely on third party information sources.

Posted in Milford, MA
Nov. 11, 2013

Medfield, MA - Home Sales and Real Estate Market Report (November, 2013)

Homes For Sale in Medfield Market Report

High prices in Medfield have finally stalled the momentum in Medfield. It hasn't really dampened prices - they remain strong, but those who are out there reaching for new highs are finding the buyers fickle.

The numbers of Homes for Sale continues to fall - it's

less than half what it was in  2011.


Can’t see the chart? You can find it Here .


The HSI has stalled. You can hardly blame the buyers though - after seeing prices jump 10% in about 3 months, their reluctance to keep pushing them up is understandable. They are likely pushing West, as they often do - searching for better prices if less than ideal commutes.


Only one foreclosure in Medfield, inventory in this town of bank owned properties has been thin for over a year. I don't think Home Sellers in Medfield need to be overly worried. Inventories are at a record low, and pressure remains on prices. But the buyers look like they have found their limit for now.


Medfield Houses For Sale and Sold Market Statistics - Raw MLS Data


  • Medfield “Home Seller Index” (HSI):126 Last Report:125
  • There are 43 homes listed as For Sale in Medfield.

    The sharp rise in Medfield home prices has halted

     this fall- for now.

  • There have been 113 houses sold in the last 6 months, and 56 homes sold in the last 3 months.
  • The Average number of Days on Market was 101 days for just SOLD homes.
  • There is an Average Market Time of 151 days of the homes For Sale (currently for sale).
  • The amount that was paid in Dollars per Square Foot averaged $255 (vs. $252)
  • There was an Average Sold Price of $669,833 for sold homes.
  • Medfield, MA, has 0 properties advertised as lender owned/foreclosure (typically foreclosure) .
  • Medfield has x properties advertised as a short-sale is going to be needed by lender .


*All statistics are for Single Family Houses and based on data in MLS. Matt’s HSI is proprietary.

More Great Reads!

About Matt Heisler

Matt Heisler is a real-estate professional and owner of this website. He has been selling homes in MA for buyers and sellers for over 20 years. He is an expert in foreclosure purchases, short-sale purchases, short-sale sales, buy and hold investing, fix and flip investing, and of course traditional residential home sales. He is happy to take questions as they pertain to real estate on Title V, Radon, Termites, Sump Pumps, Roofs, Foundations, Wells, Septic Systems, Cash-Flow, Staging, and a host of other housing issues. As a Vanderbilt University alumnus, he is proud to serve his local community.

Do Good Things Today! Matt Heisler

*All information is posted in good faith and is assumed to be reliable, but may rely on third party information sources.

Posted in Medfield, MA
Nov. 10, 2013

Marlborough, MA - Home Sales and Real Estate Market Report (November, 2013)

Homes For Sale in Marlborough Market Report

Hudson and Marlborough often follow the same pattern, and they are definitely doing that at the moment. Marlborough is much bigger, but other than a much larger sales volume, we see the very same trends in place for home sales and home buyer demand.

With the HSI above 150, and the number

of home sales 40% above the recent high, prices

are under pressure in Marlborough


Can’t see the chart? You can find it Here .


Things are strong; the number of homes for sale is down, sales are up (both records), and prices are up to. Clearly the rising prices are moving everyone up at this point, at least east of 495 (and some towns beyond.).


There is also some bank impacted inventory here - about 10% - which is higher than we are seeing in the other markets. Hudson was high too, so this is now a stat I will be looking for as we go forward.


Marlborough Houses For Sale and Sold Market Statistics - Raw MLS Data


  • Marlborough “Home Seller Index” (HSI)155: Last Report:137
  • There are 73 homes listed as For Sale in Marlborough.

    Red is also the color of the Marlborough

    Housing Market.  It's Hot!

  • There have been 244  houses sold in the last 6 months, and 121  homes sold in the last 3 months.
  • The Average number of Days on Market was 74 days for just SOLD homes.
  • There is an Average Market Time of 141 days of the homes For Sale (currently for sale).
  • The amount that was paid in Dollars per Square Foot averaged $170   (vs. $161 )
  • There was an Average Sold Price of $334,541 for sold homes.
  • Marlborough, MA, has 6 properties (vs. 2 in the last report) advertised as lender owned/foreclosure (typically foreclosure) .
  • Marlborough has 3 properties advertised as a short-sale is going to be needed by lender .


*All statistics are for Single Family Houses and based on data in MLS. Matt’s HSI is proprietary.

More Great Reads!

About Matt Heisler

Matt Heisler is a real-estate professional and owner of this website. He has been selling homes in MA for buyers and sellers for over 20 years. He is an expert in foreclosure purchases, short-sale purchases, short-sale sales, buy and hold investing, fix and flip investing, and of course traditional residential home sales. He is happy to take questions as they pertain to real estate on Title V, Radon, Termites, Sump Pumps, Roofs, Foundations, Wells, Septic Systems, Cash-Flow, Staging, and a host of other housing issues. As a Vanderbilt University alumnus, he is proud to serve his local community.

Do Good Things Today! Matt Heisler

*All information is posted in good faith and is assumed to be reliable, but may rely on third party information sources.

Posted in Marlborough, MA